|

AUD/USD Price Analysis: Seen falling to 0.7350 after breaching key daily support

  • AUD/USD wallows in yearly lows after the 0.7400 level caves in.
  • The pair breaches key support on the daily chart at 0.7480.
  • The aussie eyes more losses, with the daily RSI still not oversold.

AUD/USD remains on a downward spiral for the third straight day this Monday, starting out a new week on the wrong footing, courtesy of the growing fears over the rapid spread of the Delta covid variant worldwide.

Covid cases in the UK and Australia jumped over the weekend, with Victoria announcing an extension to the lockdown, dents the sentiment around the higher-yielding aussie.

Investors flock to the safe-haven US dollar in times of uncertainty and panic, adding to the losses in the currency pair.

The downtrend in the spot could be also contributed to a bearish technical setup on the daily chart. The bears tightened their grip after the price breached the critical falling trendline support on the said time frame at 0.7380.

The 14-day Relative Strength Index (RSI) points south, sitting outside the oversold territory, suggesting that there is more play to the downside.

Therefore, a test of the 0.7350 psychological level cannot be ruled out if the yearly lows yield into the renewed selling pressure.

AUD/USD daily chart

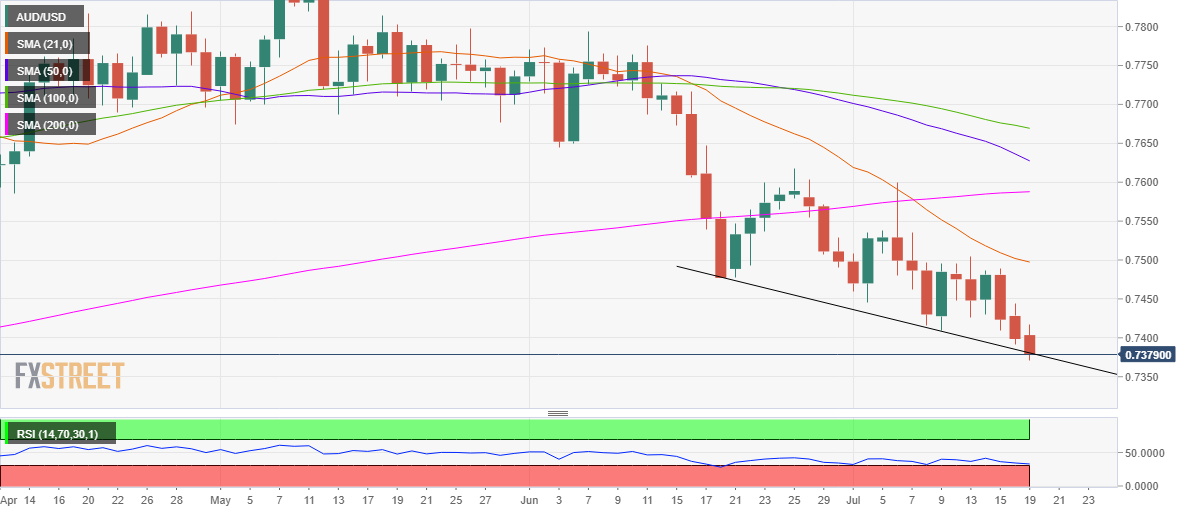
On the other hand, any pullback attempts would face an immediate supply zone around daily highs of 0.7417.

Further up, Friday's high of 0.7444 could challenge the bullish commitments on the road to recovery.

AUD/USD additional levels to watch

AUD/USD

Overview
Today last price0.7377
Today Daily Change-0.0020
Today Daily Change %-0.27
Today daily open0.7398
 
Trends
Daily SMA200.7503
Daily SMA500.7636
Daily SMA1000.7673
Daily SMA2000.7587
 
Levels
Previous Daily High0.7444
Previous Daily Low0.7391
Previous Weekly High0.7504
Previous Weekly Low0.7391
Previous Monthly High0.7794
Previous Monthly Low0.7477
Daily Fibonacci 38.2%0.7411
Daily Fibonacci 61.8%0.7424
Daily Pivot Point S10.7378
Daily Pivot Point S20.7358
Daily Pivot Point S30.7325
Daily Pivot Point R10.7431
Daily Pivot Point R20.7464
Daily Pivot Point R30.7484

Author

Dhwani Mehta

Dhwani Mehta

FXStreet

Residing in Mumbai (India), Dhwani is a Senior Analyst and Manager of the Asian session at FXStreet. She has over 10 years of experience in analyzing and covering the global financial markets, with specialization in Forex and commodities markets.

More from Dhwani Mehta
Share:

Editor's Picks

EUR/USD: Bears retain control below 1.1780-1.1770 confluence breakpoint

The EUR/USD pair remains on the back foot through the Asian session on Friday and currently trades just above mid-1.1700s, well within striking distance of a nearly one-month low set the previous day.

GBP/USD seems vulnerable near one-month low as traders await US data

The GBP/USD pair prolongs its weekly downtrend for the fifth consecutive day on Friday and slides back closer to a nearly one-month low, touched the previous day. Spot prices trade below mid-1.3400s during the Asian session on Friday and seem vulnerable to slide further as traders now look to important US macro data for a fresh impetus.

Gold eyes next breakout on US GDP, PCE inflation data

Gold sticks to recent gains around the $5,000-mark early Friday, biding time before the high-impact US macro events. The focus is now on the US fourth-quarter Gross Domestic Product, core Personal Consumption Expenditures Price Index and the Supreme Court’s ruling on President Donald Trump’s tariffs.

Bitcoin, Ethereum and Ripple remain range-bound as breakdown risks rise

Bitcoin, Ethereum, and Ripple are trading sideways within consolidation ranges on Friday, signaling a lack of directional bias in the broader crypto market. BTC rebounded from key support, and ETH is nearing the lower consolidation boundary, while XRP is holding at its lower trendline boundary. 

Hawkish Fed minutes and a market finding its footing

It was green across the board for US Stock market indexes at the close on Wednesday, with most S&P 500 names ending higher, adding 38 points (0.6%) to 6,881 overall. At the GICS sector level, energy led gains, followed by technology and consumer discretionary, while utilities and real estate posted the largest losses.

Official Trump price approaches breakout with mixed signals from traders

Official Trump (TRUMP) is trading at $3.50 at the time of writing, approaching its upper consolidation range. A breakout from this range could open the door for an upside move. On-chain data shows market indecision, with balanced flows between bulls and bears, signaling a lack of clear directional bias.