|

AUD/USD Price Analysis: Remains on the defensive around 0.6530

  • AUD/USD attracts some selling pressure near 0.6530, losing 0.65% for the day.
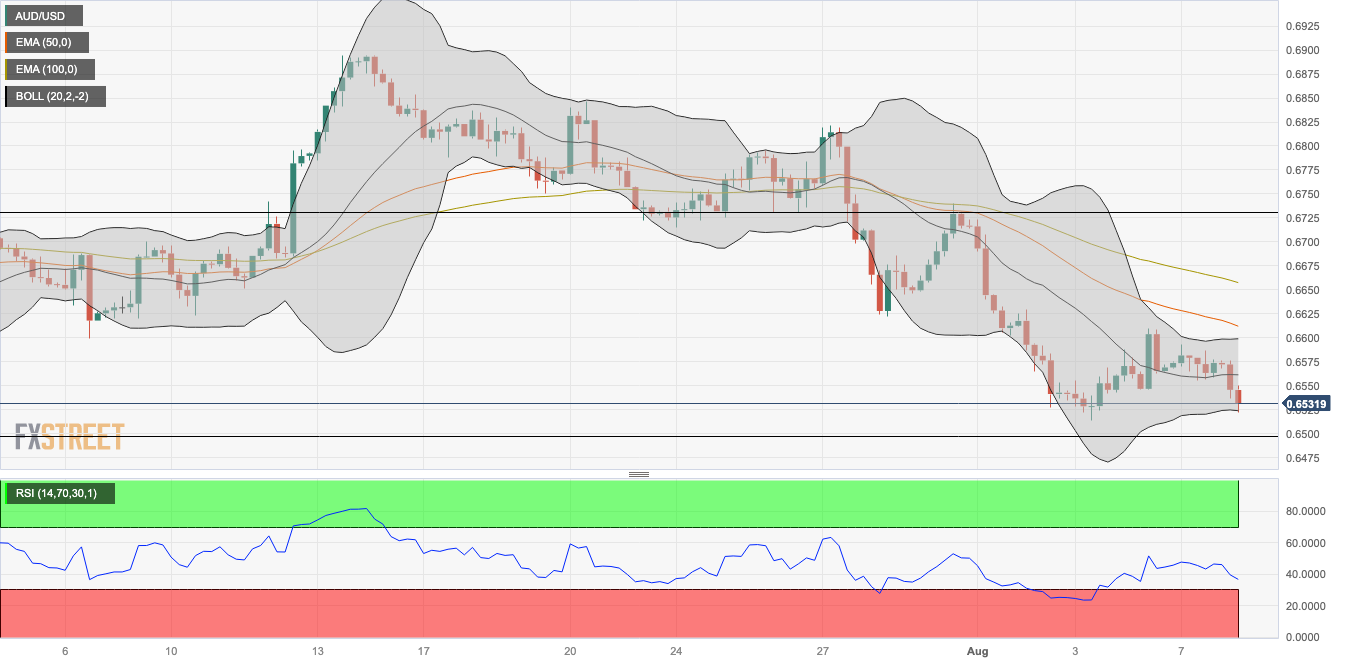
  • The pair holds below the 50- and 100-hour EMAs on the four-hour chart.
  • The initial support level is seen at 0.6525; 0.6560 acts as an immediate resistance level.

The AUD/USD pair remains under pressure and trades on a defensive note around the 0.6530 mark heading into the early European session on Tuesday. The prevalent US Dollar buying bias following the hawkish comment from Atlanta Federal Reserve (Fed) Governor Michelle Bowman supports the US Dollar and exerts pressure on AUD/USD. The major pair currently trades around 0.6531, losing 0.65% for the day.

Furthermore, the mixed economic reading from Australia and China joins the headline about geopolitical tension between Japan and China, exerts pressure on the China-proxy Australian Dollar (AUD), and caps the upside in the AUD/USD pair.

From a technical perspective, AUD/USD holds below the 50- and 100-hour Exponential Moving Averages (EMAs) on the four-hour chart, which means further downside looks favourable for the time being.

That said, any intraday pullback below 0.6525 (the lower limit of the Bollinger Band) would expose the next contention level in the 0.6490 area (Low of May 26). Further south, the next stop of the AUD/USD is located at 0.6460 (Low of May 31) and finally at 0.6400 (the confluence of a psychological round figure and the low of Nov 2022).

Looking at the upside, some follow-through buying towards the upper boundary of the Bollinger Band around 0.6560 will see a rally to the next barrier at the 0.6600–0.6610 zone. The mentioned level highlights the confluence of a psychological round figure and a 50-hour EMA. Following that, AUD/USD has room to test the additional upside filter at 0.6655 (the 100-hour EMA) en route to 0.6700 (High of July 31, round figure).

The Relative Strength Index (RSI) stands below 50, challenging the pair’s immediate downside for the time being.

AUD/USD four-hour chart

AUD/USD

Overview
Today last price0.653
Today Daily Change-0.0044
Today Daily Change %-0.67
Today daily open0.6574
 
Trends
Daily SMA200.6716
Daily SMA500.6702
Daily SMA1000.6688
Daily SMA2000.6734
 
Levels
Previous Daily High0.6593
Previous Daily Low0.6555
Previous Weekly High0.674
Previous Weekly Low0.6514
Previous Monthly High0.6895
Previous Monthly Low0.6599
Daily Fibonacci 38.2%0.6579
Daily Fibonacci 61.8%0.657
Daily Pivot Point S10.6555
Daily Pivot Point S20.6536
Daily Pivot Point S30.6517
Daily Pivot Point R10.6593
Daily Pivot Point R20.6612
Daily Pivot Point R30.663

Author

Lallalit Srijandorn

Lallalit Srijandorn is a Parisian at heart. She has lived in France since 2019 and now becomes a digital entrepreneur based in Paris and Bangkok.

More from Lallalit Srijandorn
Share:

Editor's Picks

AUD/USD eyes 0.7150 barrier nine-day EMA

AUD/USD inches higher after registering modest losses in the previous day, trading around 0.7130 during the Asian hours. The technical analysis of the daily chart indicates that the pair is moving sideways within the rectangle pattern, suggesting a consolidation as neither the bulls nor the bears have enough momentum to take control of the market.

USD/JPY trades below 160.00 intervention threshold; bullish bias intact

The USD/JPY pair attracts some sellers during the Asian session amid fears that authorities will step in again to prop up the Japanese Yen. Furthermore, the Israel-Lebanon truce prompts some profit-taking around the US Dollar and exerts downward pressure on the currency pair.

Gold rebounds from one-week low as Israel-Lebanon truce pressures safe-haven USD

Gold gains some positive traction on Thursday and climbs to the $4,475 area during the Asian session, reversing a major part of the previous day's slide to a one-week low. The Israel-Lebanon truce prompts some profit-taking around the US Dollar and supports the commodity. 


Hyperliquid: ETF demand, capital rotation fuel HYPE rally as Bitcoin melts

Hyperliquid price sustains an upward trend near its all-time high of $75.76 on Thursday after posting 80% gains in May, while Bitcoin (BTC) retraces below $65,000, triggering a market-wide panic.

Kevin Warsh takes the Fed helm: What it means for the US Dollar
The Federal Reserve moves away from the highly predictable "forward guidance" model of the Jerome Powell era to a new “Kevin Warsh environment”, characterized by less communication, more policy surprises, and an increased focus on the Fed's complex balance sheet.
Recession on paper: What really moves the Canadian Loonie now?

Statistics Canada handed the headline writers a gift and the analysts a headache. Real GDP shrank 0.1% on an annualized basis in the first quarter, and with the fourth quarter of 2025 revised down to a 1.0% contraction, that is two negative quarters in a row, the textbook definition of a technical recession and Canada's first since the pandemic.