AUD/USD Price Analysis: Pausing within new uptrend
- AUD/USD is consolidating after reversing its short-term trend and beginning a new uptrend.
- A break above 0.6624 would confirm more upside for the pair.
- AUD/USD may have formed a Measured Move with a final target at around 0.6690.

AUD/USD is trading in the 0.6610s on Friday after pulling back from resistance at the 0.6624 barrier.
The pair is probably in a short-term uptrend, evidenced by the rising sequence of peaks and troughs since the April 19 lows, visible on the 4-hour chart
AUD/USD 4-hour Chart
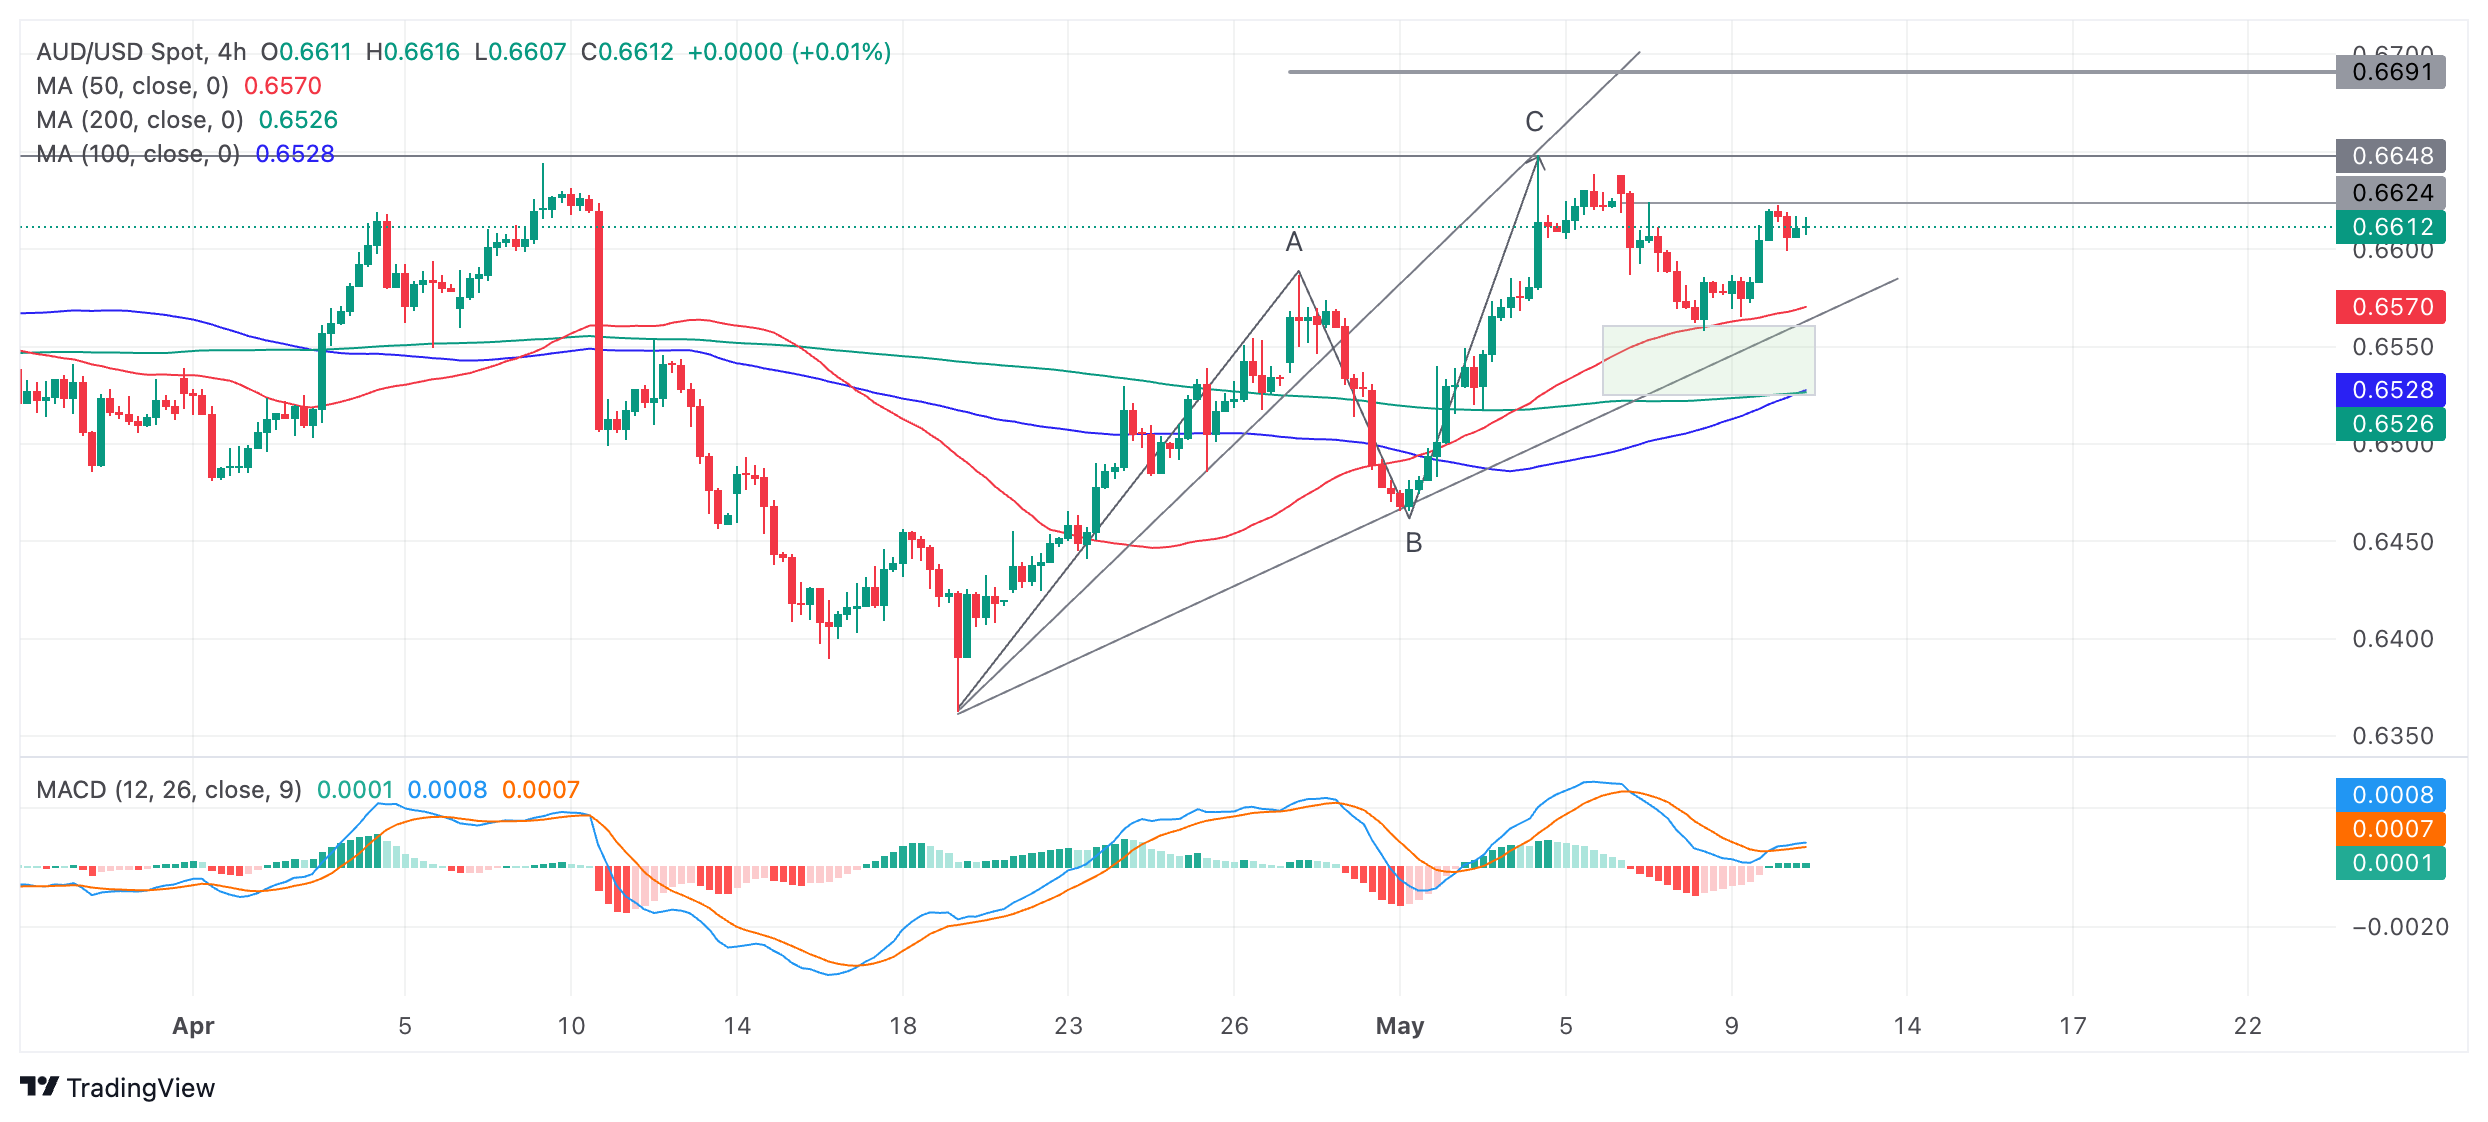
Given the old saying that “the trend is your friend” the resumption of the uptrend suggests AUD/USD will continue higher.
A re-break above the 0.6624 highs would provide confirmation of further upside to the next target at the 0.6649 resistance level of the May 3 high. Following that, the next target would be at around 0.6680-90.
The second target is generated by a possible Measured Move pattern that AUD/USD has formed since the April 19 lows. These patterns are like large zig-zags composed of three waves, labeled A, B and C on the chart. The general expectation is that wave C will be either the same length as A or a Fibonacci 0.681 of A.
Wave C has already reached the Fibonacci 0.681 target of the Measured Move at the May 3 highs, however, there is a chance it could go all the way to the second target where C=A at 0.6690.
The Moving Average Convergence Divergence (MACD) momentum indicator has crossed above its signal line, giving a buy signal. The MACD has also started printing green histogram bars, further adding to the weight of bullish evidence.
That said, it is still possible the correction from the May 3 highs may have further to run before the uptrend properly resumes.
In the advent of more weakness, the rectangular pale green zone drawn on the chart just above the lower trendline is likely to provide a cushion of support for price. From there price will probably resume its uptrend.
Alternatively, a decisive break below the trendline would be a bearish sign, suggesting a potential reversal of the trend.
A decisive break would be one accompanied by a long red candle which closes near its low or three red candles in a row that break below the trendline.
Author

Joaquin Monfort
FXStreet
Joaquin Monfort is a financial writer and analyst with over 10 years experience writing about financial markets and alt data. He holds a degree in Anthropology from London University and a Diploma in Technical analysis.


