|

AUD/USD Price Analysis: Needs to set a platform for a breakout above 0.6900

  • AUD/USD is expected to shift into an inventory accumulation process for a breakout above 0.6900.
  • The US Dollar Index has dropped to near 103.70 as the overall risk profile is solid.
  • An oscillation in the 40.00-60.00 range by the RSI (14) indicates a consolidation ahead.

The AUD/USD pair has displayed a gradual decline and has slipped to near 0.6820 in the Tokyo session after facing barricades around 0.6890. The Aussie asset has corrected but has not surrendered its upside bias amid an overall risk appetite theme.

Meanwhile, S&P500 futures have sensed some sell-off in Asia after failing to extend its recovery recorded on Wednesday, showing some caution in underpinning the risk-on profile. The US Dollar Index (DXY) has dropped significantly to near 103.70 as investors didn’t find any hawkish cues in the Federal Open Market Committee (FOMC) minutes apart from Federal Reserve (Fed) chair Jerome Powell’s commentary in December’s monetary policy meeting.

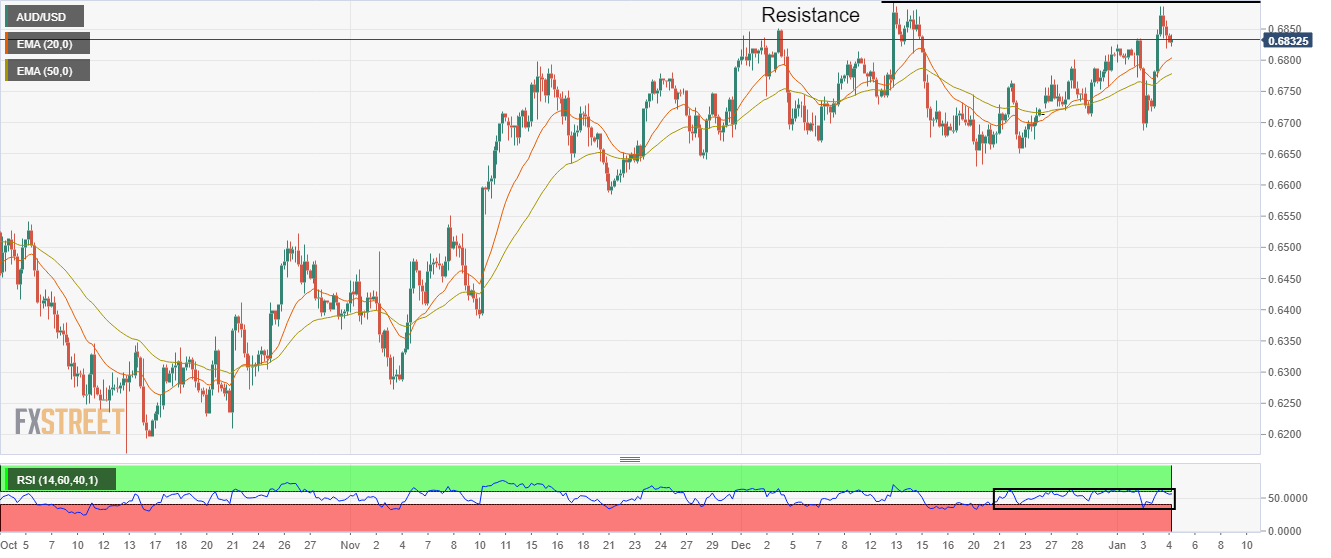
AUD/USD has sensed some sell-off while attempting to recapture the horizontal resistance plotted from December 13 high at 0.6893 on a four-hour scale. On a usual basis, inventory accumulation below potential resistances is healthy for a confident breakout. The absence of bearish reversal signs is bolstering the fact of a rangebound action ahead.

Advancing 20-and 50-period Exponential Moving Averages (EMAs) at 0.6805 and 0.6780 respectively add to the upside filters.

The Relative Strength Index (RSI) (14) is oscillating in a 40.00-60.00 range, which indicates the absence of a potential trigger for a decisive move.

For a fresh rally, the Aussie asset needs to deliver a decisive break above December 13 high at 0.6893, which will drive the major towards August 30 high at 0.6956 and the psychological resistance at 0.7000.

On the contrary, a downside move below December 29 low at 0.6710 will drag the major further towards December 22 low at 0.6650 followed by November 21 low at 0.6585.

AUD/USD four-hour chart

AUD/USD

Overview
Today last price0.6834
Today Daily Change-0.0004
Today Daily Change %-0.06
Today daily open0.6838
 
Trends
Daily SMA200.6751
Daily SMA500.6669
Daily SMA1000.6636
Daily SMA2000.6853
 
Levels
Previous Daily High0.6886
Previous Daily Low0.6717
Previous Weekly High0.6821
Previous Weekly Low0.671
Previous Monthly High0.6893
Previous Monthly Low0.6629
Daily Fibonacci 38.2%0.6822
Daily Fibonacci 61.8%0.6782
Daily Pivot Point S10.6741
Daily Pivot Point S20.6644
Daily Pivot Point S30.6571
Daily Pivot Point R10.691
Daily Pivot Point R20.6983
Daily Pivot Point R30.708

Author

Sagar Dua

Sagar Dua

FXStreet

Sagar Dua is associated with the financial markets from his college days. Along with pursuing post-graduation in Commerce in 2014, he started his markets training with chart analysis.

More from Sagar Dua
Share:

Editor's Picks

AUD/USD eyes 0.7150 barrier nine-day EMA

AUD/USD inches higher after registering modest losses in the previous day, trading around 0.7130 during the Asian hours. The technical analysis of the daily chart indicates that the pair is moving sideways within the rectangle pattern, suggesting a consolidation as neither the bulls nor the bears have enough momentum to take control of the market.

USD/JPY trades below 160.00 intervention threshold; bullish bias intact

The USD/JPY pair attracts some sellers during the Asian session amid fears that authorities will step in again to prop up the Japanese Yen. Furthermore, the Israel-Lebanon truce prompts some profit-taking around the US Dollar and exerts downward pressure on the currency pair.

Gold defends 200-day SMA at $4,425, but for how long?

Gold is attempting a tepid recovery toward $4,500 early Thursday, as renewed optimism in the Mideast geopolitical front calms market nerves. This cautious optimism across Asian markets weighs on Oil prices, and diminishes the US Dollar’s safe-haven appeal, helping Gold stage a decent comeback from the weekly low of $4,424.


Hyperliquid: ETF demand, capital rotation fuel HYPE rally as Bitcoin melts

Hyperliquid price sustains an upward trend near its all-time high of $75.76 on Thursday after posting 80% gains in May, while Bitcoin (BTC) retraces below $65,000, triggering a market-wide panic.

Kevin Warsh takes the Fed helm: What it means for the US Dollar
The Federal Reserve moves away from the highly predictable "forward guidance" model of the Jerome Powell era to a new “Kevin Warsh environment”, characterized by less communication, more policy surprises, and an increased focus on the Fed's complex balance sheet.
Recession on paper: What really moves the Canadian Loonie now?

Statistics Canada handed the headline writers a gift and the analysts a headache. Real GDP shrank 0.1% on an annualized basis in the first quarter, and with the fourth quarter of 2025 revised down to a 1.0% contraction, that is two negative quarters in a row, the textbook definition of a technical recession and Canada's first since the pandemic.