AUD/USD Price Analysis: Mildly bid inside bear flag, 0.7005 is the key


  • AUD/USD consolidates recent losses inside bearish chart pattern.
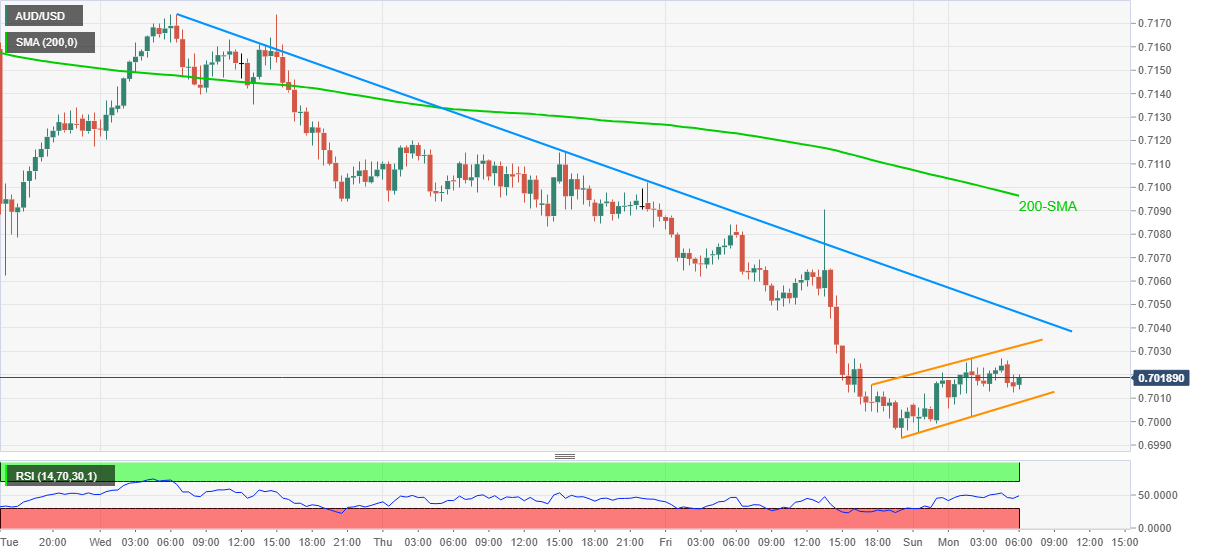
  • Monthly resistance line, 200-SMA also challenge bulls, RSI hints at further grinding towards the south.
  • November 2020 low acts as extra support before theoretical target near 0.6825.

AUD/USD struggles to extend corrective pullback from yearly low, retreats to 0.7015 heading into Monday’s European session. The Aussie pair portrays a short-term bearish chart pattern, called bear flag, on the 30-minute play, up 0.17% intraday at the latest.

It should be noted, however, that the RSI line hints at further consolidation of the prices before confirming the formation with a downside break of 0.7005 support.

Also adding to the downside filter is the November 2020 low near 0.6990.

If the quote drops below 0.6990, it becomes vulnerable, at least theoretically, to aim for the 0.6825 support level.

Meanwhile, recovery moves remain elusive below the upper line of the stated flag, near 0.7035 at the latest.

Additionally challenging AUD/USD buyers is a downward sloping trend line from December 01 and 200-DMA, respectively near 0.7050 and 0.7100.

AUD/USD: 30-minute chart

Trend: Further weakness expected

Additional important levels

Overview
Today last price 0.7015
Today Daily Change 0.0011
Today Daily Change % 0.16%
Today daily open 0.7004
 
Trends
Daily SMA20 0.723
Daily SMA50 0.7325
Daily SMA100 0.7326
Daily SMA200 0.75
 
Levels
Previous Daily High 0.7102
Previous Daily Low 0.6993
Previous Weekly High 0.7174
Previous Weekly Low 0.6993
Previous Monthly High 0.7537
Previous Monthly Low 0.7063
Daily Fibonacci 38.2% 0.7035
Daily Fibonacci 61.8% 0.706
Daily Pivot Point S1 0.6964
Daily Pivot Point S2 0.6924
Daily Pivot Point S3 0.6855
Daily Pivot Point R1 0.7073
Daily Pivot Point R2 0.7142
Daily Pivot Point R3 0.7182


Share: Feed news

Information on these pages contains forward-looking statements that involve risks and uncertainties. Markets and instruments profiled on this page are for informational purposes only and should not in any way come across as a recommendation to buy or sell in these assets. You should do your own thorough research before making any investment decisions. FXStreet does not in any way guarantee that this information is free from mistakes, errors, or material misstatements. It also does not guarantee that this information is of a timely nature. Investing in Open Markets involves a great deal of risk, including the loss of all or a portion of your investment, as well as emotional distress. All risks, losses and costs associated with investing, including total loss of principal, are your responsibility. The views and opinions expressed in this article are those of the authors and do not necessarily reflect the official policy or position of FXStreet nor its advertisers. The author will not be held responsible for information that is found at the end of links posted on this page.

If not otherwise explicitly mentioned in the body of the article, at the time of writing, the author has no position in any stock mentioned in this article and no business relationship with any company mentioned. The author has not received compensation for writing this article, other than from FXStreet.

FXStreet and the author do not provide personalized recommendations. The author makes no representations as to the accuracy, completeness, or suitability of this information. FXStreet and the author will not be liable for any errors, omissions or any losses, injuries or damages arising from this information and its display or use. Errors and omissions excepted.

The author and FXStreet are not registered investment advisors and nothing in this article is intended to be investment advice.

Recommended content


Recommended content

Editors’ Picks

EUR/USD holds above 1.0700 ahead of key US data

EUR/USD holds above 1.0700 ahead of key US data

EUR/USD trades in a tight range above 1.0700 in the early European session on Friday. The US Dollar struggles to gather strength ahead of key PCE Price Index data, the Fed's preferred gauge of inflation, and helps the pair hold its ground. 

EUR/USD News

USD/JPY stays above 156.00 after BoJ Governor Ueda's comments

USD/JPY stays above 156.00 after BoJ Governor Ueda's comments

USD/JPY holds above 156.00 after surging above this level with the initial reaction to the Bank of Japan's decision to leave the policy settings unchanged. BoJ Governor said weak Yen was not impacting prices but added that they will watch FX developments closely.

USD/JPY News

Gold price oscillates in a range as the focus remains glued to the US PCE Price Index

Gold price oscillates in a range as the focus remains glued to the US PCE Price Index

Gold price struggles to attract any meaningful buyers amid the emergence of fresh USD buying. Bets that the Fed will keep rates higher for longer amid sticky inflation help revive the USD demand.

Gold News

Sei Price Prediction: SEI is in the zone of interest after a 10% leap

Sei Price Prediction: SEI is in the zone of interest after a 10% leap

Sei price has been in recovery mode for almost ten days now, following a fall of almost 65% beginning in mid-March. While the SEI bulls continue to show strength, the uptrend could prove premature as massive bearish sentiment hovers above the altcoin’s price.

Read more

US core PCE inflation set to signal firm price pressures as markets delay Federal Reserve rate cut bets

US core PCE inflation set to signal firm price pressures as markets delay Federal Reserve rate cut bets

The core PCE Price Index, which excludes volatile food and energy prices, is seen as the more influential measure of inflation in terms of Fed positioning. The index is forecast to rise 0.3% on a monthly basis in March, matching February’s increase. 

Read more

Forex MAJORS

Cryptocurrencies

Signatures