AUD/USD Price Analysis: MACD favors bears, six-month-old resistance line to cap any bounce
- AUD/USD trades near the lowest since February 2009.
- Bearish MACD signals and sustained trading below the key support (now resistance) favor the sellers.

AUD/USD declines to 0.6639, down 0.60%, while heading into the European session on Thursday. The pair slumped to the lowest in 11 years after breaking a downward slopping trend line from early-August 2019.
Even if the oversold conditions of RSI increase the odds of a pullback, buyers will look for entry only beyond 0.6660.
In doing so, 0.6700 can please the short-term traders ahead of challenging them with a confluence of 21-day SMA and a two-week-long falling trend line, around 0.6730.
Alternatively, 0.6600 and highs marked during late-February 2009, around 0.6550/45 will lure the sellers during further downside.
AUD/USD daily chart
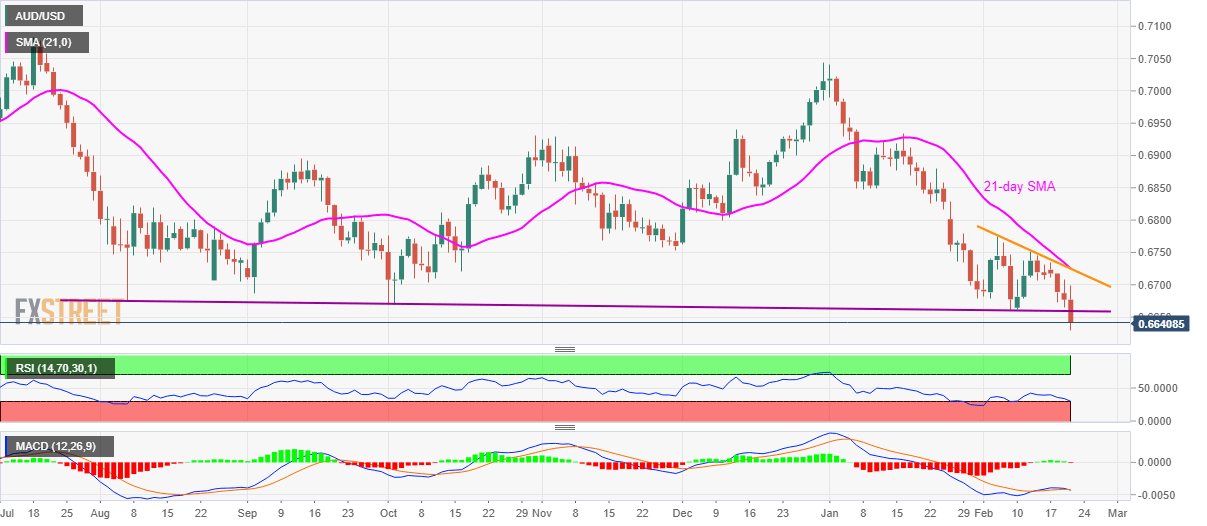
Trend: Bearish
Author

Anil Panchal
FXStreet
Anil Panchal has nearly 15 years of experience in tracking financial markets. With a keen interest in macroeconomics, Anil aptly tracks global news/updates and stays well-informed about the global financial moves and their implications.


