|

AUD/USD Price Analysis: Keeps the red above 0.7600 mark, bearish bias remains

  • A strong pickup in the USD demand prompted some selling around AUD/USD on Friday.
  • The downside remained limited as bulls showed some resilience below the 0.7600 mark.
  • The recent rangebound moves constitute the formation of a bearish rectangle pattern.

The AUD/USD pair struggled to capitalize on its intraday bounce from over one-week lows and met with some fresh supply near the 0.7640 region. The pair was last seen trading just above the 0.7600 mark, down around 0.55% for the day.

A strong pickup in the US Treasury bond yields assisted the US dollar to stage a solid rebound from two-week lows. This, in turn, was seen as a key factor that prompted some aggressive selling around the AUD/USD pair on Friday.

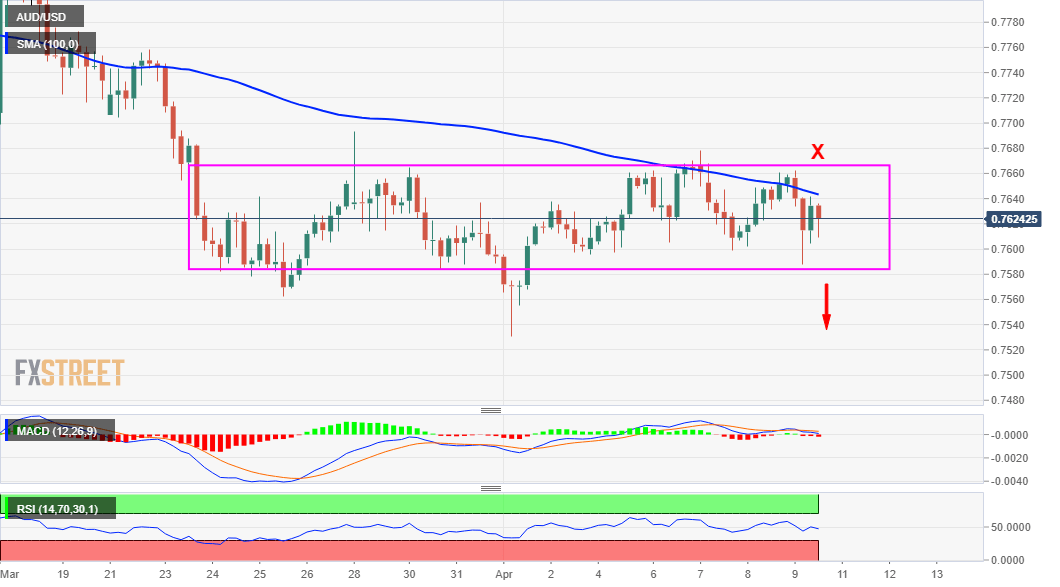
From a technical perspective, the pair has been oscillating in a 100 pips broader trading range since March 24. Bulls have been struggling to break through the 0.7660-70 resistance zone but showed some resilience below the 0.7600 mark. The range-bound price action constitutes the formation of a rectangle on short-term charts. Given the recent pullback from multi-year tops, around the 0.8000 psychological mark, this could be categorized as a bearish continuation pattern.

The rectangle pattern, however, is not complete until a breakout has occurred. This makes it prudent to wait for a sustained break through the trading range before determining the AUD/USD pair's next leg of a directional move.

Meanwhile, technical indicators on the daily chart have been drifting lower in the bearish territory and are still far from being in the oversold zone. This, in turn, supports prospects for an eventual break on the downside. Hence, a subsequent slide back towards YTD lows, around the 0.7530, en-route the key 0.7500 handle, remains a distinct possibility. The downward trajectory could further drag the AUD/USD pair towards the 0.7460 support area.

On the flip side, any attempted recovery might continue to confront stiff resistance and meet with some fresh supply near the 0.7660-70 region. That said, a sustained move beyond might negate the bearish outlook. The AUD/USD pair might then aim back to reclaim the 0.7700 round-figure mark. The short-covering move could further get extended and allow bulls to test the next relevant resistance near the 0.7745-50 supply zone.

AUD/USD 4-hour chart

fxsoriginal

Technical levels to watch

AUD/USD

Overview
Today last price0.7624
Today Daily Change-0.0028
Today Daily Change %-0.37
Today daily open0.7652
 
Trends
Daily SMA200.7667
Daily SMA500.7715
Daily SMA1000.7651
Daily SMA2000.7407
 
Levels
Previous Daily High0.766
Previous Daily Low0.7602
Previous Weekly High0.7694
Previous Weekly Low0.7531
Previous Monthly High0.785
Previous Monthly Low0.7562
Daily Fibonacci 38.2%0.7638
Daily Fibonacci 61.8%0.7624
Daily Pivot Point S10.7616
Daily Pivot Point S20.758
Daily Pivot Point S30.7558
Daily Pivot Point R10.7675
Daily Pivot Point R20.7697
Daily Pivot Point R30.7733

Author

Haresh Menghani

Haresh Menghani is a detail-oriented professional with 10+ years of extensive experience in analysing the global financial markets.

More from Haresh Menghani
Share:

Editor's Picks

EUR/USD looks weak below 1.1800

EUR/USD has slipped back under pressure, breaking through the 1.1800 support and drifting towards the weekly lows near 1.1770 ahead of the opening bell in Asia. The move reflects renewed strength in the US Dollar, with steady geopolitical tensions keeping its demand firm. Moving forward, the release of the German labour market report and flash inflation figures should keep European investors entertained on Friday.
 

GBP/USD threatens the 200-day SMA near 1.3440

GBP/USD rapidly leaves behind Wednesday’s strong advance, coming under heavy pressure and retesting the 1.3440 zone, where the critical 200-day SMA is located. Cable’s deep pullback follows the strong gains in the Greenback, while investors continue to pencil in a potential BoE rate cut in March.

Gold remains below $5,200 despite tariff jitters and geopolitical risks

Gold is seen consolidating in a range below the $5,200 mark during the Asian session on Friday amid mixed cues. Trade jitters, along with the risk of a potential US-Iran war, act as a tailwind for the safe-haven bullion. Meanwhile, the Fed's hawkish outlook keeps the US Dollar close to the monthly high and caps the non-yielding yellow metal. Nevertheless, the commodity remains on track to register gains for the fourth straight week, though the fundamental backdrop warrants some caution for bullish traders.

How AI, blockchain, stablecoins are shaping a new global economy – Circle CEO Jeremy Allaire

Artificial Intelligence (AI), blockchain technology and stablecoins are emerging as core pillars of a new global economic system, according to Circle’s CEO, Jeremy Allaire.

Changing the game: International implications of recent tariff developments

The Supreme Court ruling on International Emergency Economic Powers Act (IEEPA) tariffs provides limited relief for the rest of the world, with weighted average tariff rates modestly lower.

Bitcoin steadies as traders eye US–Iran talks

Bitcoin (BTC) price is stabilizing around $68,000 at the time of writing on Thursday after a 6.2% relief rally the previous day amid a broader downward trend.