|

AUD/USD Price Analysis: Keeps bounce off 200-EMA above 0.6750 with eyes on Fed Chair Powell

  • AUD/USD prints mild gains to pare the biggest daily loss in a month, snaps three-day losing streak.
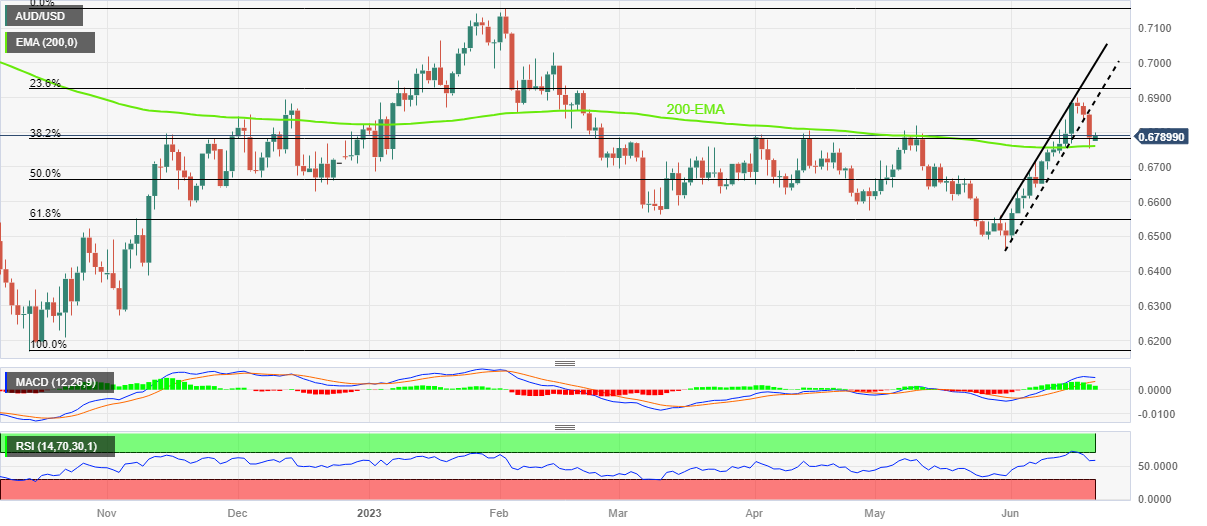
  • Rejection of monthly bullish channel keeps Aussie bears hopeful unless the quote stays below 0.6890.
  • Multiple technical levels, bullish MACD signals and upbeat RSI conditions challenge bears.

AUD/USD bulls struggle to regain the 0.6800 round figure while printing mild gains around the intraday high of 0.6799 heading into Wednesday’s European session. In doing so, the Aussie pair prints the first daily gains in four while bouncing off the 200-day Exponential Moving Average (EMA).

However, the previous day’s clean rejection of the three-week-old bullish channel keeps the AUD/USD sellers hopeful unless the quote rises past the stated channel’s lower line, close to 0.6890 by the press time.

Also acting as the upside filter is the 0.6900 round figure and the top line of the aforementioned rising channel, near the 0.7000 threshold.

It’s worth noting that the MACD signals are still bullish and the RSI (14) line suggests a continuation of the latest rebound by staying above 50.0 but not overbought.

As a result, the AUD/USD buyers may keep the reins unless the quote stays beyond the 200-EMA level of 0.6760.

Even if the quote drops below 0.6760, the 50% Fibonacci retracement level of 0.6665 and the lows marked in April and March, respectively near 0.6575 and 0.6565, can test the AUD/USD bears before giving them control.

Fundamentally, the AUD/USD pair faces multiple challenges from the Fed and China concerns.

Also read: AUD/USD pares weekly losses around 0.6800 as markets brace for Fed Chair Powell’s testimony

AUD/USD: Daily chart

Trend: Limited recovery expected

Additional important levels

Overview
Today last price0.6789
Today Daily Change0.0004
Today Daily Change %0.06%
Today daily open0.6785
 
Trends
Daily SMA200.667
Daily SMA500.6679
Daily SMA1000.6723
Daily SMA2000.6692
 
Levels
Previous Daily High0.6855
Previous Daily Low0.6753
Previous Weekly High0.69
Previous Weekly Low0.6732
Previous Monthly High0.6818
Previous Monthly Low0.6458
Daily Fibonacci 38.2%0.6792
Daily Fibonacci 61.8%0.6816
Daily Pivot Point S10.674
Daily Pivot Point S20.6696
Daily Pivot Point S30.6638
Daily Pivot Point R10.6842
Daily Pivot Point R20.69
Daily Pivot Point R30.6945

Author

Anil Panchal

Anil Panchal

FXStreet

Anil Panchal has nearly 15 years of experience in tracking financial markets. With a keen interest in macroeconomics, Anil aptly tracks global news/updates and stays well-informed about the global financial moves and their implications.

More from Anil Panchal
Share:

Editor's Picks

EUR/USD remains heavy near 1.1600 after hot EU inflation data

EUR/USD remains heavily offered near 1.1600, six-week lows, in the European session on Tuesday. The pair fails to find any inspiration from a surprise pick up in Eurozone inflation for February, as the US Dollar continues to attract safe haven flows amid escalating geopolitical tensions in the Middle East. 

GBP/USD attacks 1.3300, refreshing three-month lows

GBP/USD is deep in the red near 1.3300, accelerating its downside to renew three-month lows in European trading on Tuesday. The ongoing escalation in the Iran war, combined with rising Oil prices, weighs negatively on the higher-yielding Pound Sterling as the US Dollar capitalizes on increased haven demand.

Gold falls below $5,300 as stronger USD counter Middle East woes

Gold attracts some intraday selling and falls below $5,300 on Tuesday. The US Dollar climbs to a fresh high since January 20 and turns out to be a key factor exerting downward pressure on the commodity. However, concerns about a broader regional conflict in the Middle East continue to weigh on investors' sentiment and underpin demand for the traditional safe-haven bullion.

Stellar risks deeper losses as derivatives metrics turn negative

Stellar is trading red below $0.16 at the time of writing on Tuesday, after a slight recovery the previous day. Weakening derivatives data caps the recovery, while an unfavorable technical outlook projects a deeper correction for the XLM token in the upcoming days.

Middle East conflict ramps up a gear as energy price spike rips through markets

It’s another risk off day as geopolitical headwinds continue to batter financial markets. Although markets calmed during the US session and US stocks managed to post gains on Monday, this has not fed through to the European session, and stocks and bonds are sharply lower for a second day.

Hyperliquid Price Forecast: HYPE rises on commodities demand amid US-Iran war

Hyperliquid (HYPE) steadies above $33 at press time on Tuesday, marking its fourth consecutive day of recovery in a broadly volatile market due to the ongoing US-Israel strikes on Iran.