|

AUD/USD Price Analysis: Dives to two-week lows, further below 0.7700 mark

  • AUD/USD witnessed some heavy selling on Tuesday and tumbled below the 0.7700 mark.
  • The technical set-up favours bearish traders and supports prospects for further weakness.
  • A subsequent slide below the 0.7620 area (monthly lows) would mark a fresh bearish break.

The AUD/USD pair weakened further below the 0.7700 mark and dropped to near two-week lows heading into the European session. The pair was last seen trading near the 0.7680-75 region, down around 0.85% for the day.

A rare coordinated move by the US, Canada, UK and EU to impose sanctions on Chinese officials over human rights violations in Xinjiang took its toll on the China-proxy aussie. Apart from this, a softer risk tone provided a modest lift to the safe-haven US dollar and further drove flows away from the perceived riskier Australian dollar.

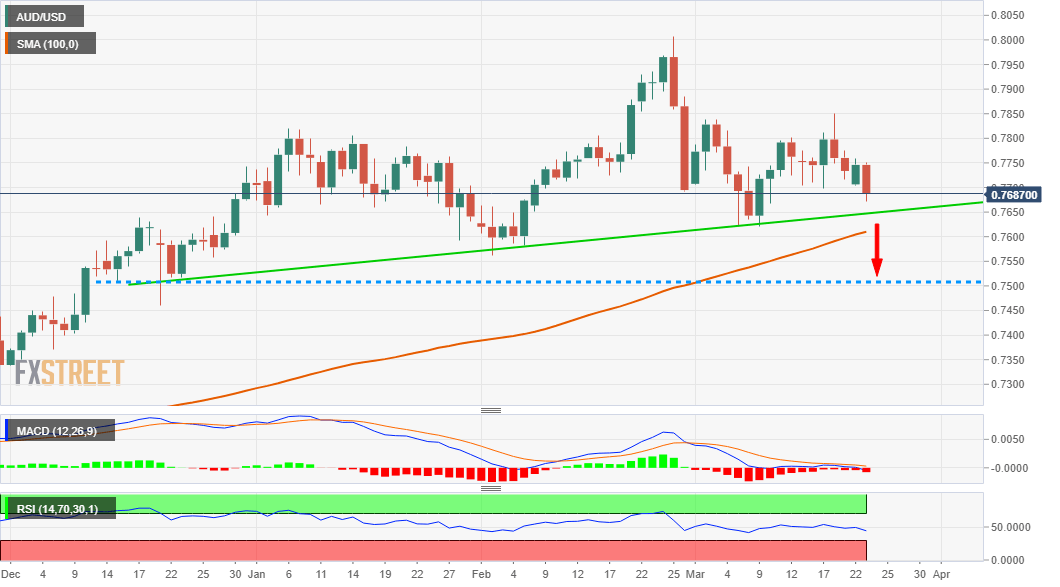
From a technical perspective, a sustained break below the 0.7700 strong horizontal support was seen as a fresh trigger for bearish traders. This, in turn, might have already set the stage for additional Weakness. The bearish outlook is reinforced by the fact that technical indicators on the daily chart have just started drifting into the negative territory


Hence, a subsequent slide towards monthly swing lows, around the 0.7620 region touched on March 5, now looks a distinct possibility. The latter coincides with the 100-day SMA support, which if broken decisively should pave the way for an extension of the recent sharp pullback from the key 0.8000 psychological mark, or the highest level since February 2018.

The AUD/USD pair might then turn vulnerable to slide further below the 100-day SMA support, around the 0.7600 mark and aim to test the next relevant support near the 0.7530-25 horizontal zone.

On the flip side, any attempted recovery move might now be seen as a selling opportunity and runs the risk of fizzling out rather quickly. Bearish traders would look to enter near the 0.7700 mark and any subsequent move up is more likely to remain capped near the 0.7745-50 supply zone.

AUD/USD daily chart

fxsoriginal

Technical levels to watch

AUD/USD

Overview
Today last price0.7677
Today Daily Change-0.0069
Today Daily Change %-0.89
Today daily open0.7746
 
Trends
Daily SMA200.7771
Daily SMA500.7743
Daily SMA1000.7605
Daily SMA2000.736
 
Levels
Previous Daily High0.7758
Previous Daily Low0.7704
Previous Weekly High0.785
Previous Weekly Low0.7698
Previous Monthly High0.8008
Previous Monthly Low0.7562
Daily Fibonacci 38.2%0.7737
Daily Fibonacci 61.8%0.7725
Daily Pivot Point S10.7714
Daily Pivot Point S20.7682
Daily Pivot Point S30.766
Daily Pivot Point R10.7768
Daily Pivot Point R20.779
Daily Pivot Point R30.7822

Author

Haresh Menghani

Haresh Menghani is a detail-oriented professional with 10+ years of extensive experience in analysing the global financial markets.

More from Haresh Menghani
Share:

Markets move fast. We move first.

Orange Juice Newsletter brings you expert driven insights - not headlines. Every day on your inbox.

By subscribing you agree to our Terms and conditions.

Editor's Picks

EUR/USD struggles to extend advance above 1.1800

The EUR/USD pair posts a fresh weekly low near 1.1740 during the Asian trading session on Wednesday. The major currency pair is under pressure as the US Dollar edges higher despite Federal Open Market Committee minutes of the December policy meeting, released on Tuesday, showing that most policymakers stressed the need for further interest rate cuts.

GBP/USD tests 1.3450 support after moving below nine-day EMA

GBP/USD remains subdued for the second consecutive day, trading around 1.3460 during the Asian hours on Wednesday. The technical analysis of the daily chart indicates a weakening of a bullish bias as the pair is positioned slightly below the lower boundary of the ascending channel pattern.

Gold jumps on US rate cut prospects, safe-haven demand

Gold price extends the rally above $4,350 during the early European trading hours on Wednesday. Gold's price has surged about 65% this year and is set to record its biggest annual gains since 1979. The rally in the precious metal is bolstered by the prospect of further US interest rate cuts in 2026. Lower interest rates could reduce the opportunity cost of holding Gold, supporting the non-yielding precious metal.

Bitcoin, Ethereum and XRP prepare for a potential New Year rebound

Bitcoin, Ethereum, and Ripple are holding steady on Wednesday after recording minor gains on the previous day. Technically, Bitcoin could extend gains within a triangle pattern while Ethereum and Ripple face critical overhead resistance. 

Economic outlook 2026-2027 in advanced countries: Solidity test

After a year marked by global economic resilience and ending on a note of optimism, 2026 looks promising and could be a year of solid economic performance. In our baseline scenario, we expect most of the supportive factors at work in 2025 to continue to play a role in 2026.

Crypto market outlook for 2026

Year 2025 was volatile, as crypto often is.  Among positive catalysts were favourable regulatory changes in the U.S., rise of Digital Asset Treasuries (DAT), adoption of AI and tokenization of Real-World-Assets (RWA).