AUD/USD Price Analysis: Dives to two-week low, bears flirt with 100-day SMA around 0.6715
- AUD/USD drifts lower for the second straight day and drops to a two-week low on Friday.
- A combination of factors continues to push the USD higher and exerts pressure on the pair.
- Some follow-through selling below the 100-day SMA will pave the way for further losses.

The AUD/USD pair remains under some selling pressure for the second successive day on Friday - also marking the fifth day of a negative move in the previous six - and drops to a two-week low during the Asian session. Spot prices currently trade around the 0.6715 area, down 0.60% for the day, and now seems vulnerable to extend its recent pullback from a nearly four-month high touched last week.
The US Dollar (USD) gains some follow-through positive traction on Friday and builds on the previous day's goodish recovery move from its lowest level since May 11, which, in turn, is seen as a key factor exerting pressure on the AUD/USD pair. Federal Reserve (Fed) Chair Jerome Powell, during his two-day congressional testimony, repeated his view that interest rates will likely rise again this year to combat stubbornly high inflation. This, along with worries about a global economic downturn and a weaker risk tone, benefits the safe-haven buck and drives flows away from the risk-sensitive Aussie.
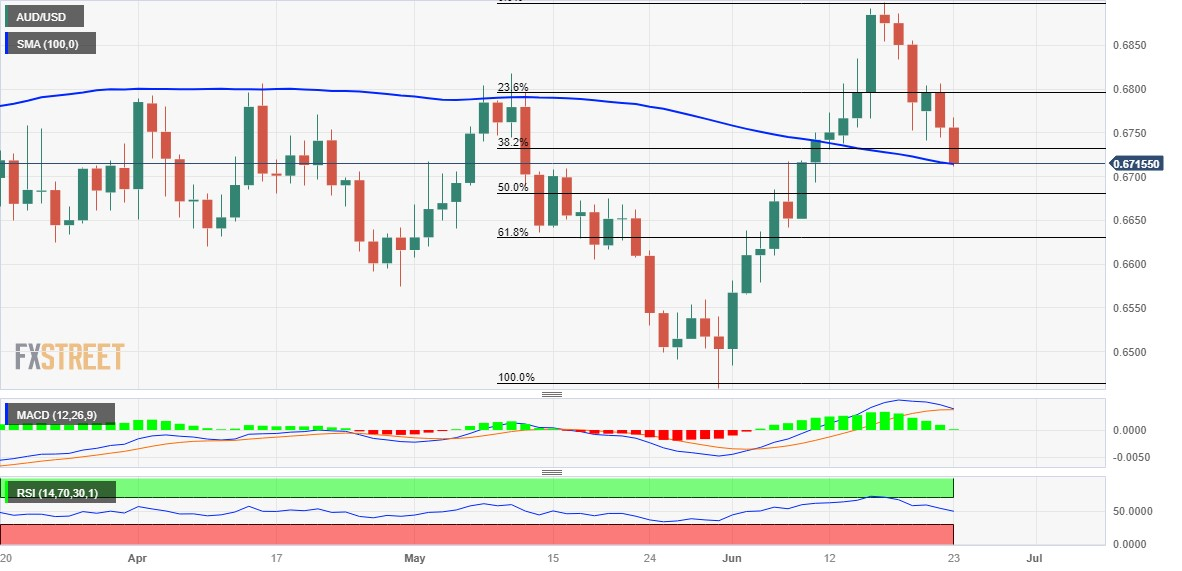
From a technical perspective, the intraday slide drags the AUD/USD pair below the 38.2% Fibonacci retracement level of the recent rally from the YTD low touched in May and is now flirting with the 100-day Simple Moving Average (SMA). Any subsequent fall is more likely to attract some buyers near the 0.6690-0.6680 confluence - comprising the very important 200-day SMA and the 50% Fibo. level. This should act as a pivotal point, which if broken decisively will set the stage for an extension of the recent rejection slide from the 0.6900 mark, or a nearly four-month high touched last Friday.
The AUD/USD pair might then accelerate the downfall towards the 0.6625 area, or the 61.8% Fibo. level, en route to the 0.6600 round-figure mark. Some follow-through selling will shift the bias in favour of bearish traders and pave the way for a slide towards the 0.6545-0.6540 intermediate support. Spot prices might then aim to challenge the 0.6500 psychological mark before eventually dropping to the YTD low, around the 0.6460-0.6455 region touched in May.
On the flip side, the 0.6730 zone, or the 38.2% Fibo. level, now seems to act as an immediate hurdle ahead of the daily top, near the 0.6765-0.6770 region. The next relevant hurdle is pegged near 23.6% Fibo. level, around the 0.6800 mark. A sustained strength beyond the latter will suggest that the corrective decline has run its course and lift the AUD/USD pair toward the 0.6855-0.6860 resistance. Spot prices might then make a fresh attempt to conquer the 0.6900 mark.
AUD/USD daily chart
Key levels to watch
Author

Haresh Menghani
FXStreet
Haresh Menghani is a detail-oriented professional with 10+ years of extensive experience in analysing the global financial markets.


