|

AUD/USD Price Analysis: Corrective bounce seeks acceptance from 0.6655 hurdle and Australia inflation

  • AUD/USD pares the biggest daily loss in eight days with minor gains.
  • One-month-old horizontal support, oversold RSI (14) put a floor under Aussie prices.
  • Six-week-long previous support line guards recovery moves ahead of Australia CPI for Q1 and March.

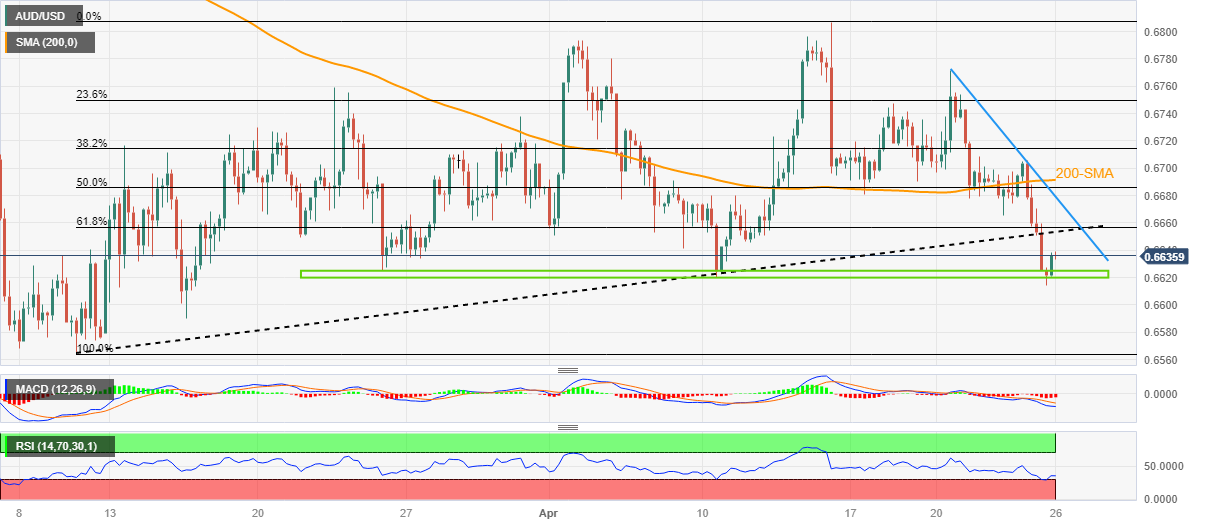
AUD/USD prints mild gains around 0.6630 as it consolidates the biggest daily loss in a week ahead of the Australia Consumer Price Index (CPI) amid early Wednesday. In doing so, the Aussie pair rebounds from a horizontal area comprising multiple levels marked since late March amid an oversold RSI (14) line.

The recovery moves, however, lack upside momentum amid bearish MACD signals. Also challenging the AUD/USD buyers is the quote’s sustained downside break of a 1.5-month-old previous support line, now immediate resistance near 0.6655. Furthermore, likely downbeat prints of Aussie inflation and the Reserve Bank of Australia’s (RBA) dovish bias keep the pair sellers hopeful.

Even so, the quote needs to provide a successful break of the aforementioned horizontal support surrounding 0.6620-25 to convince the AUD/USD bears.

Following that, the yearly low marked in March around 0.6565 will be in the spotlight.

Meanwhile, recovery moves need to cross the support-turned-resistance line of around 0.6655 to convince intraday buyers of the AUD/USD pair.

However, a downward-sloping resistance line from April 20 and the 200-SMA, respectively near 0.6680 and 0.6690, quickly followed by the 0.6700 round figure, could challenge the Aussie pair buyers afterward.

To sum up, AUD/USD remains on the bear’s radar even if the quote bounces off short-term key support.

AUD/USD: Four-hour chart

Trend: Limited upside expected

Additional important levels

Overview
Today last price0.6636
Today Daily Change0.0010
Today Daily Change %0.15%
Today daily open0.6626
 
Trends
Daily SMA200.6702
Daily SMA500.6714
Daily SMA1000.6797
Daily SMA2000.6741
 
Levels
Previous Daily High0.6706
Previous Daily Low0.6614
Previous Weekly High0.6772
Previous Weekly Low0.6678
Previous Monthly High0.6784
Previous Monthly Low0.6564
Daily Fibonacci 38.2%0.6649
Daily Fibonacci 61.8%0.6671
Daily Pivot Point S10.6592
Daily Pivot Point S20.6558
Daily Pivot Point S30.6501
Daily Pivot Point R10.6683
Daily Pivot Point R20.674
Daily Pivot Point R30.6774

Author

Anil Panchal

Anil Panchal

FXStreet

Anil Panchal has nearly 15 years of experience in tracking financial markets. With a keen interest in macroeconomics, Anil aptly tracks global news/updates and stays well-informed about the global financial moves and their implications.

More from Anil Panchal
Share:

Markets move fast. We move first.

Orange Juice Newsletter brings you expert driven insights - not headlines. Every day on your inbox.

By subscribing you agree to our Terms and conditions.

Editor's Picks

EUR/USD edges above 1.1750 due to ECB-Fed policy divergence

EUR/USD has recovered its recent losses registered in the previous session, trading around 1.1760 during the Asian hours on Friday. Traders will likely observe Germany’s Manufacturing Purchasing Managers’ Index data later in the day.

GBP/USD gathers strength above 1.3450 on Fed rate cut bets, BoE's gradual policy path

The GBP/USD pair gathers strength to around 1.3480 during the early Asian session on Friday. Expectations of the US Federal Reserve rate cuts this year weigh on the US Dollar against the Pound Sterling. Philadelphia Fed President Anna Paulson is set to speak later on the weekend. 

Gold climbs to near $4,350 on Fed rate cut bets, geopolitical risks

Gold price rises to near $4,345 during the early Asian session on Friday. Gold finished 2025 with a significant rally, achieving an annual gain of around 65%, its biggest annual gain since 1979. The rally of the precious metal is bolstered by the prospect of further US interest rate cuts in 2026 and safe-haven flows.

Bitcoin, Ethereum and Ripple enter the New Year with breakout hopes

Bitcoin, Ethereum, and Ripple entered the new year trading at key technical levels on Friday, as traders seek fresh directional cues in January. With BTC locked in a tight range, ETH is approaching its 50-day Exponential Moving Average, while XRP is nearing resistance. A clear breakout across these top three cryptocurrencies could help define market momentum in the opening weeks of the year.

Economic outlook 2026-2027 in advanced countries: Solidity test

After a year marked by global economic resilience and ending on a note of optimism, 2026 looks promising and could be a year of solid economic performance. In our baseline scenario, we expect most of the supportive factors at work in 2025 to continue to play a role in 2026.

Crypto market outlook for 2026

Year 2025 was volatile, as crypto often is.  Among positive catalysts were favourable regulatory changes in the U.S., rise of Digital Asset Treasuries (DAT), adoption of AI and tokenization of Real-World-Assets (RWA).