|

AUD/USD Price Analysis: Confined in a range below 0.6500 mark, 100-day SMA

  • AUD/USD remains confined in a range below 0.6500 mark through the early European session.
  • Traders await a sustained breakthrough the recent range before placing fresh directional bets.

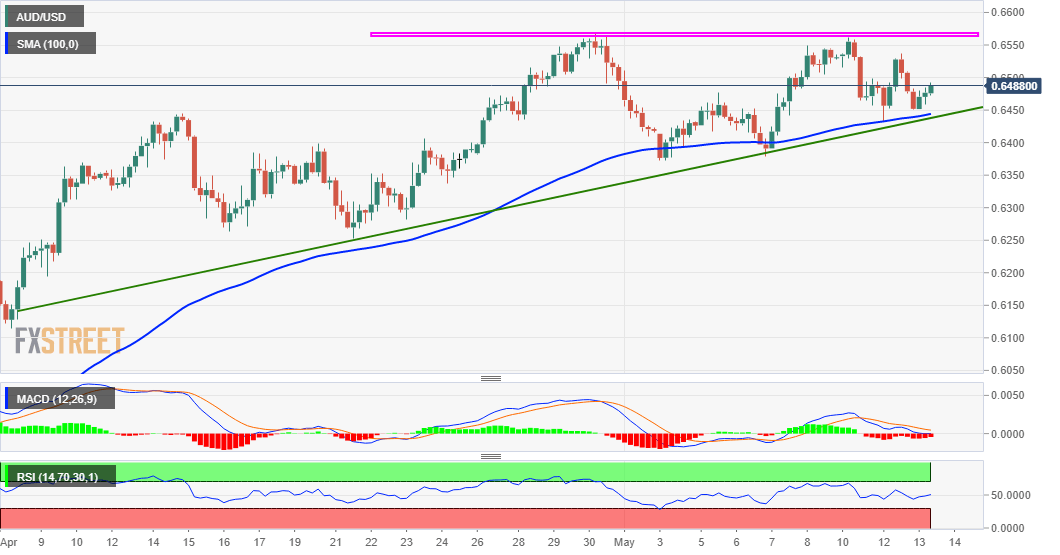
The AUD/USD pair traded with a mild positive bias through the early European session, albeit lacked any strong follow-through and remained below the key 0.6500 psychological mark. The mentioned level is followed by the 100-day SMA near the 0.6525 level and a static resistance near the 0.6560-70 zone, which has been capping the upside over the past two weeks or so.

Meanwhile, any meaningful pullbacks were being bought into near 100-period SMA on the 4-hourly chart, which coincides with a three-week-old ascending trend-line support. The combination of the 0.6560-70 horizontal barrier and an upward sloping trend-line constituted towards the formation of a bullish ascending triangle on short-term charts.

Bulls technical indicators on the daily chart further add credence to the constructive set-up and support prospects for an extension of the recent recovery from multi-year lows. However, it will be prudent to wait for a convincing break through the triangle resistance before confirming a bullish bias and positioning for any further appreciating move.

Conversely, a sustained weakness below the 0.6435-25 confluence support will negate the positive outlook and turn the pair vulnerable to slide back towards testing sub-0.6300 levels.

AUD/USD 4-hourly chart

fxsoriginal

Technical levels to watch

AUD/USD

Overview
Today last price0.6485
Today Daily Change0.0014
Today Daily Change %0.22
Today daily open0.6471
 
Trends
Daily SMA200.6419
Daily SMA500.6282
Daily SMA1000.6532
Daily SMA2000.6672
 
Levels
Previous Daily High0.6536
Previous Daily Low0.6432
Previous Weekly High0.6549
Previous Weekly Low0.6372
Previous Monthly High0.657
Previous Monthly Low0.598
Daily Fibonacci 38.2%0.6472
Daily Fibonacci 61.8%0.6497
Daily Pivot Point S10.6423
Daily Pivot Point S20.6375
Daily Pivot Point S30.6319
Daily Pivot Point R10.6527
Daily Pivot Point R20.6584
Daily Pivot Point R30.6632

Author

Haresh Menghani

Haresh Menghani is a detail-oriented professional with 10+ years of extensive experience in analysing the global financial markets.

More from Haresh Menghani
Share:

Editor's Picks

EUR/USD remains apathetic near 1.1770 post-US PCE

EUR/USD trades slightly on the back foot on Friday, hovering around the 1.1770 area as the US Dollar trims its advance on Friday. Data wise on the US docket, inflation tracked by the PCE rose a tad in December, while the flash GDP showed the economy is seen expanding below estimates at 1.4%YoY in Q4 2025.

GBP/USD clings to daily gains around 1.3470 after US data

GBP/USD keeps the bid tone unchanged near 1.3470 amid increasing upside momentum in the US Dollar, particularly after the release of US PCE and GDP figures.

Gold trims gains on US data, flirts with $5,000/oz

Gold clings to daily gains just over the key $5,000 region per troy ounce on Friday. The modest gains in the yellow metal come despite the Greenback’s recovery is picking up pace following US data releases.

Crypto Today: Bitcoin, Ethereum, XRP rebound as risk appetite improves

Bitcoin rises marginally, nearing the immediate resistance of $68,000 at the time of writing on Friday. Major altcoins, including Ethereum and Ripple, hold key support levels as bulls aim to maintain marginal intraday gains.

Week ahead – Markets brace for heightened volatility as event risk dominates

Dollar strength dominates markets as risk appetite remains subdued. A Supreme Court ruling, geopolitics and Fed developments are in focus. Pivotal Nvidia earnings on Wednesday as investors question tech sector weakness.

Official Trump price approaches breakout with mixed signals from traders

Official Trump (TRUMP) is trading at $3.50 at the time of writing, approaching its upper consolidation range. A breakout from this range could open the door for an upside move. On-chain data shows market indecision, with balanced flows between bulls and bears, signaling a lack of clear directional bias.