|

AUD/USD Price Analysis: Bears monitoring for failures at resistance

  • AUD/USD bears need a break of support to confirm a downside bias. 
  • Bulls are in charge while testing deeper into the weekly resistance. 

AUD/USD bulls are in charge on the long-term time frames, but a close below resistance will open prospects of a retracement of the daily bullish impulse. 

The following is a topdown analysis that illustrates where the next opportunity could arise on the lower time frames.

Weekly chart, AUD/USD
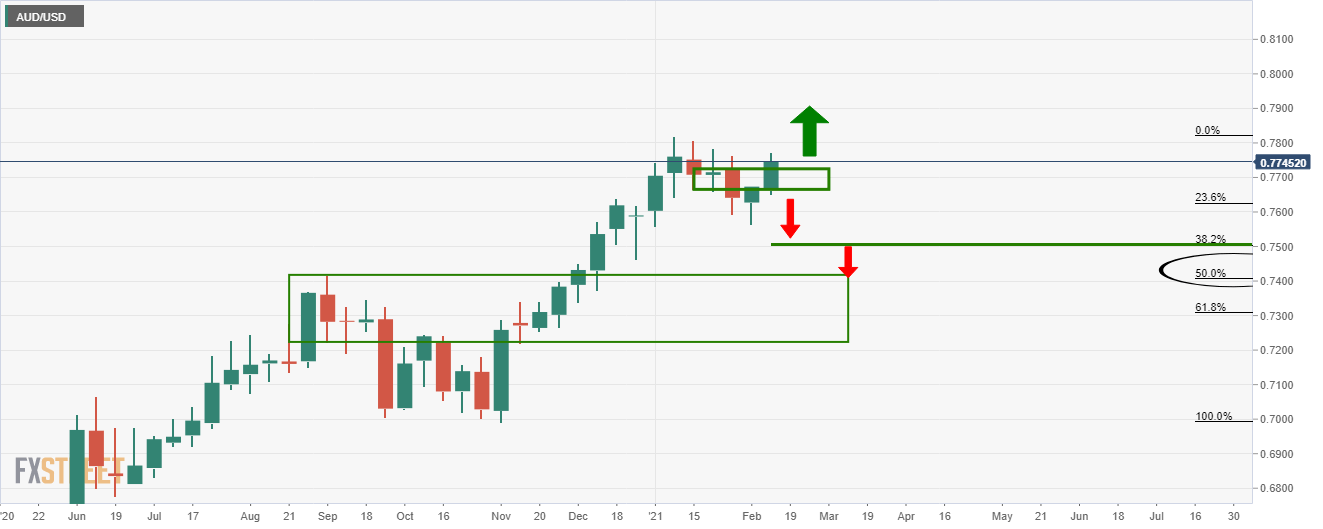
There is an upside bias so long as the price remains above this newly formed support following the recent bullish weekly test of resistance. 

A weekly close above the prior highs will negate downward trade setups. 

Daily chart, AUD/USD
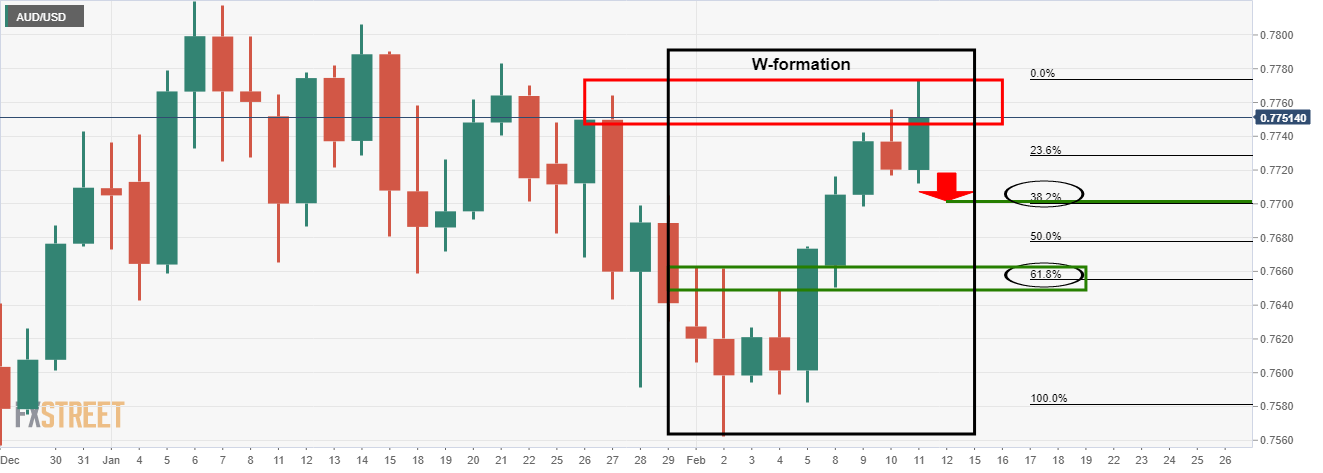
With that being said, the daily chart is offering a different scenario. 

The W-formation is a bearish chart pattern that would expect to see at least a 38.2% Fibonacci retracement of the bullish impulse.

A test of the 0.77 figure is, therefore, still o play for. However, a daily close above the prior day's highs will be bullish. 

4-hour chart, AUD/USD
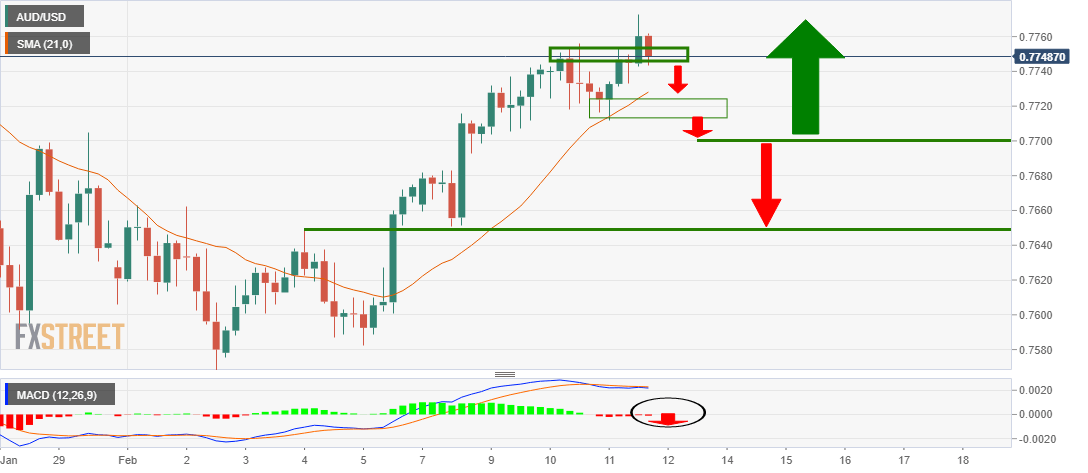
The conditions on the 4-hour chart are bullish.

There is little in the way of a high probability setup that can be taken by the bears in targeting 0.77 the figure until the bearish structure has been formed, or MACD is below the zero line and price below the 21 moving average. 

Given the proximity of the 0.77 figure and price, there is little in the way of reward and a lower time frame would be more appropriate in this scenario. 

1-hour chart
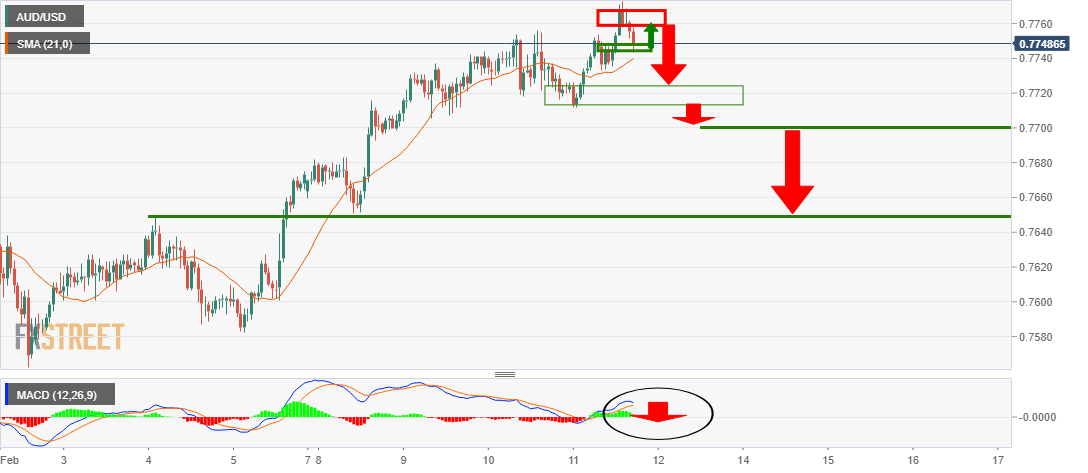
The 1-hour chart offers prospects of a trade set up if the price breaks support and retests the structure from resistance.

A break below the lows will open risk towards the neckline of the daily M-formation and confluence of a 61.8% Fibonacci retracement of the daily impulse around 0.7650. 

Author

Ross J Burland

Ross J Burland, born in England, UK, is a sportsman at heart. He played Rugby and Judo for his county, Kent and the South East of England Rugby team.


More from Ross J Burland
Share:

Editor's Picks

GBP/USD breaches below 1.3500, two-day lows

GBP/USD faces renewed selling pressure, eroding the earlier advance and slipping back to the sub-1.3500 region on Wednesday. Cable’s loss of upside momentum follows the resurgence of the demand for the Greenback amid steady geopolitical tensions. Looking ahead, the British Pound is expected to remain under scrutiny in light of the release of UK GDP data on Thursday.

EUR/USD weakens to multi-day lows near 1.1520

EUR/USD makes a U-turn and trades with decent losses near 1.1520 following the closing bell on Wall Street on Wednesday. The US Dollar’s recovery post-US CPI data keeps the risk complex under pressure in a context where geopolitics takes centre stage once again. Moving forward, attention remains on US inflation with the release of Producer Prices alongside weekly Claims.

Gold holds comfortably above $4,400 after hitting fresh 10-week highs

Gold sits above $4,400 after hitting its highest level since June 5, at $4,450, in Asia on Thursday. Gold looks to build on the uptrend, following soft US inflation data. Receding Fed-hike bets continue to drive flows towards the non-yielding bullion amid subdued US Dollar price action. However, the US-Iran standoff could limit any meaningful USD decline and cap the precious metal as traders now look to the US PPI for a fresh impetus.

Bitcoin faces thin liquidity and missing demand amid seller stress — Glassnode
Bitcoin (BTC) is showing signs of growing market exhaustion, with weakening liquidity and subdued demand leaving the market vulnerable to a sharp move, according to a Glassnode report on Wednesday. The firm stated that Bitcoin is trading between two important cost-basis levels as market activity has fallen to its lowest point since 2019.
Why is Crude Oil priced for a reopening the ships haven't made?

Fourteen vessels crossed the Strait of Hormuz on Tuesday. Before the war, the count ran near 120 a day. In the sessions since the waterway was publicly declared open, Brent has drifted back to $87 and West Texas Intermediate to $81, both a little lower again on Wednesday, with daily momentum on each unwound from the top of its range in late July to the low twenties now.

Why is Crude Oil priced for a reopening the ships haven't made?
Fourteen vessels crossed the Strait of Hormuz on Tuesday. Before the war, the count ran near 120 a day. In the sessions since the waterway was publicly declared open, Brent has drifted back to $87 and West Texas Intermediate (WTI) to $81, both a little lower again on Wednesday, with daily momentum on each unwound from the top of its range in late July to the low twenties now.