|

AUD/USD price analysis: Australian dollar bounces from daily lows, trades near 0.6840 level

  • AUD/USD remains in range despite broad-based USD strength. 
  • The level to beat for bears is the 0.6821/14 support zone.
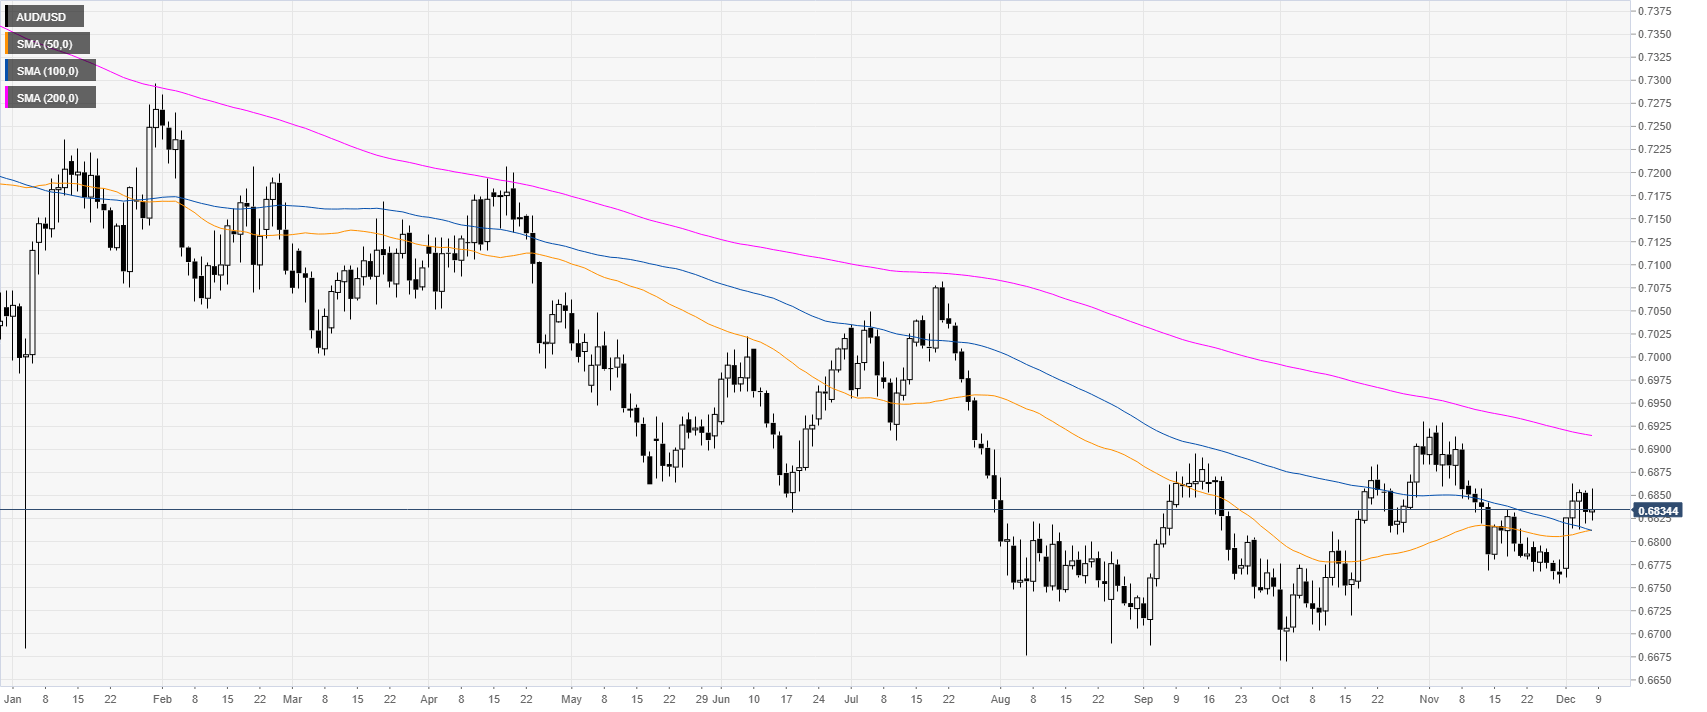


AUD/USD daily chart 

 
AUD/USD is trading in a tight range just above the 50 and 100 simple moving averages (DMAs). Although the Nonfarm Payrolls (NFP) was way better than anticipated with 266k vs. 180k expected, AUD/USD didn’t react as dramatically as other currency pairs as it is still trading within familiar ranges.
 

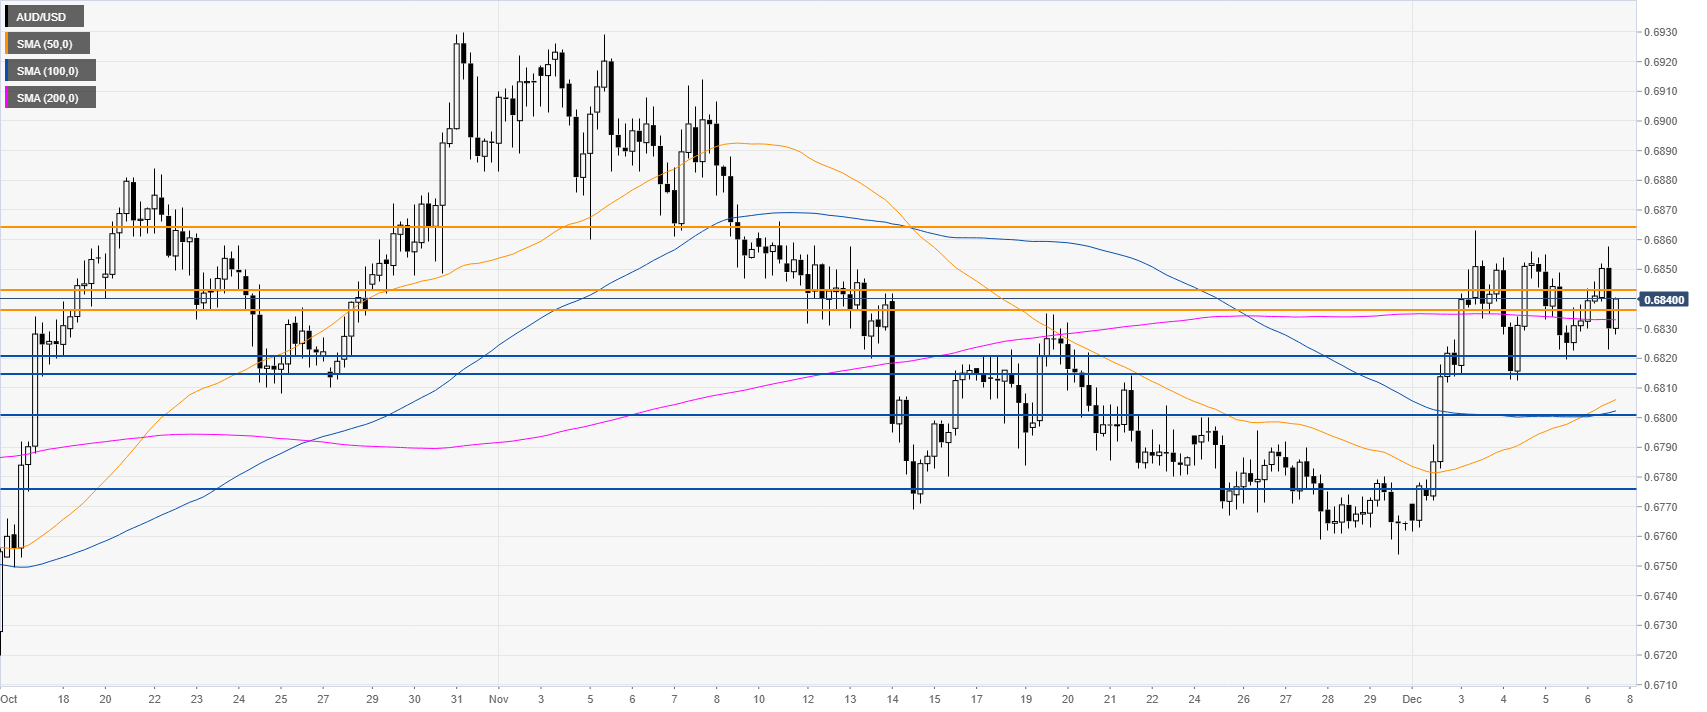
AUD/USD four-hour chart

 
The aussie is consolidating the early December gains around the 200 SMA. After the London close, the market is trading below the 0.6836/43 resistance zone. However, in the event the spot breaks this area, the bulls could drive the market to the 0.6864 level, according to the Technical Confluences Indicator
 

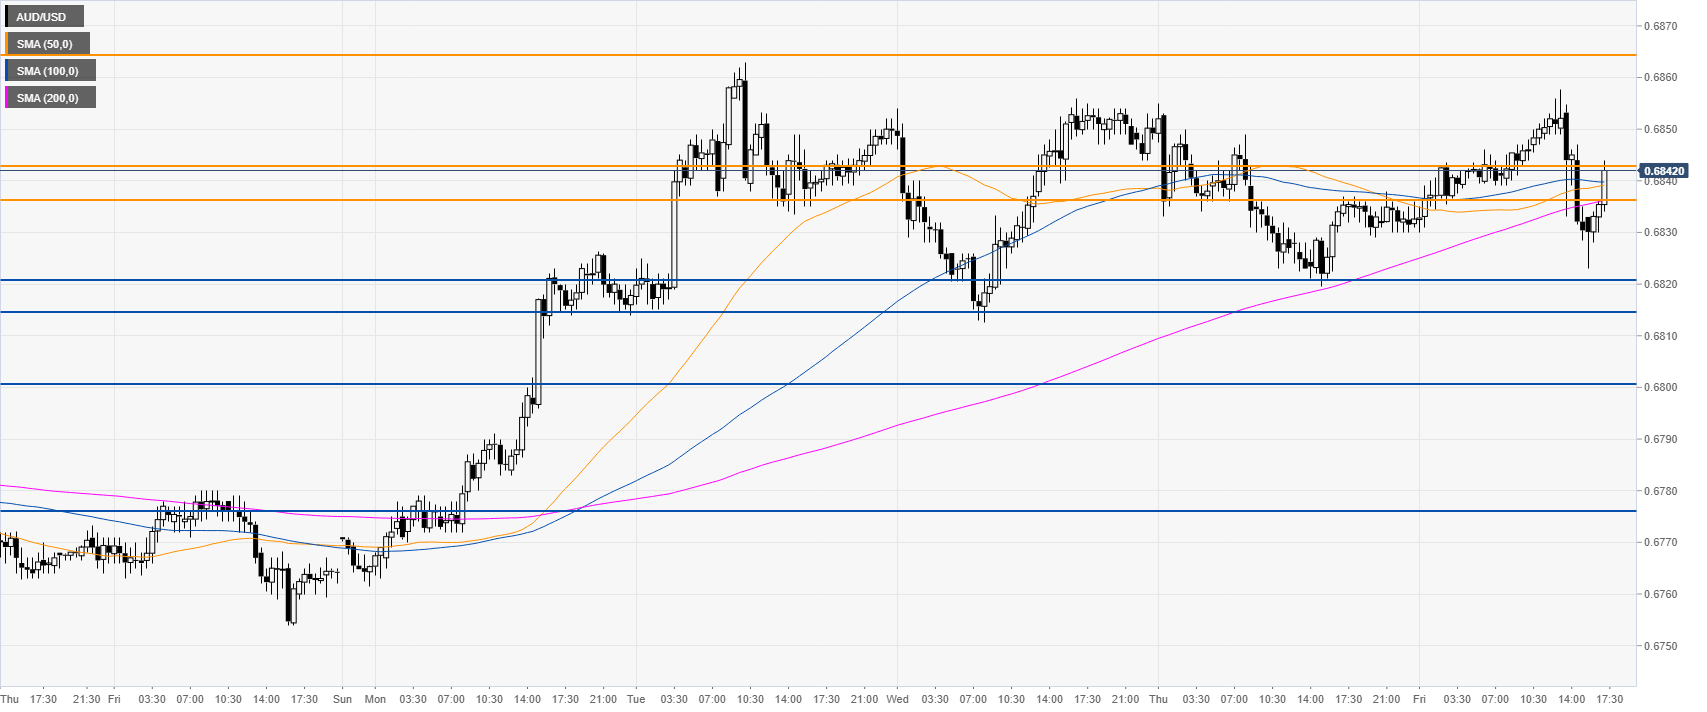
AUD/USD 30-minute chart 

 
AUD/USD is trading above the main SMAs, suggesting bullish momentum in the near term. However, a break below the 0.6821/14 support zone could lead to 0.6800, 0.6779 and 0.6775 price levels.


Additional key levels

AUD/USD

Overview
Today last price0.6838
Today Daily Change0.0006
Today Daily Change %0.09
Today daily open0.6832
 
Trends
Daily SMA200.6811
Daily SMA500.6811
Daily SMA1000.6814
Daily SMA2000.6916
 
Levels
Previous Daily High0.6855
Previous Daily Low0.682
Previous Weekly High0.68
Previous Weekly Low0.6754
Previous Monthly High0.6929
Previous Monthly Low0.6754
Daily Fibonacci 38.2%0.6833
Daily Fibonacci 61.8%0.6841
Daily Pivot Point S10.6816
Daily Pivot Point S20.68
Daily Pivot Point S30.6781
Daily Pivot Point R10.6852
Daily Pivot Point R20.6871
Daily Pivot Point R30.6887

Author

Flavio Tosti

Flavio Tosti

Independent Analyst


More from Flavio Tosti
Share:

Editor's Picks

EUR/USD eyes nine-day EMA barrier after rebounding from 1.1600

EUR/USD gains ground after registering modest losses in the previous session, trading around 1.1620 during the Asian hours on Friday. The technical analysis of the daily chart suggests an ongoing bearish bias as the pair remains within the descending channel pattern.

GBP/USD drifts lower heading into NFP range

GBP/USD edged lower by 0.2% on Thursday, settling close to 1.3350 in a strained trading session that kept the pair pinned near three-month lows. Price briefly recovered earlier in the day on reports that Iran had indirectly signaled openness to talks with the CIA, but the bounce faded as Israeli officials reportedly advised Washington to disregard the overture. 

Gold awaits US Nonfarm Payrolls for a clear directional impetus

Gold rebounds above $5,100 early Friday after testing the $5,050 level amid global sell-off. The US Dollar pulls back as profit-taking creeps in ahead of US labor data. For February. 21-day SMA holds amid bullish RSI; a daily closing above 61.8% Fibo is critical for Gold buyers.

Ethereum pull in $169M as validators pile in to stake ETH

US spot Ethereum exchange-traded funds recorded $169 million in net inflows on Wednesday, marking the largest daily intake in two months, according to SoSoValue data. The rise in inflows signals renewed institutional interest in Ethereum amid broader market volatility.

The market compass is pointing at a barrel of Oil

The Asian open is arriving with equities leaning the wrong way, and the reason is not complicated. The market’s compass needle has snapped firmly toward crude. In this tape, oil is not just another input price; it is the gravitational center around which every asset class is orbiting.

Ripple tests recovery strength amid steady ETF inflows, growing retail interest

Ripple (XRP) continues to demonstrate notable resilience as the cryptocurrency market navigates the persistent war in the Middle East after the United States (US) and Israel attacked Iran on Saturday.