|

AUD/USD Price Analysis: Aussie kicking off 2020 with a small correction below 0.7000 handle

  • AUD/USD is starting the new year, retracing a tiny part of the gains made in December.  
  • Key support is seen in the 0.6970/0.6959 price zone. 
 

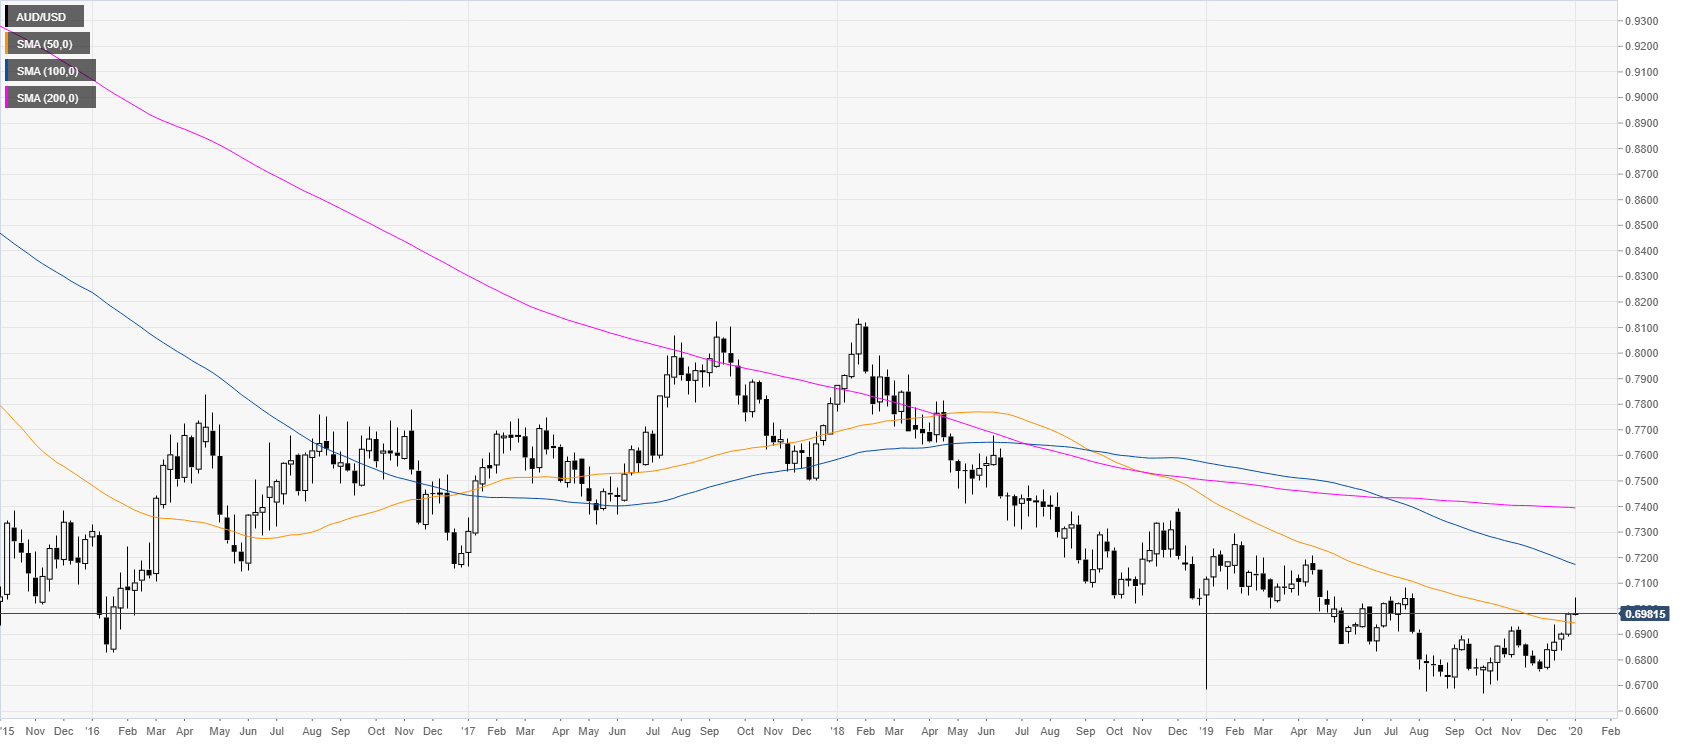
AUD/USD weekly chart

 
The aussie is kicking off 2020 while trading above the 0.6900 handle and the 50-period weekly simple moving average (SMA). In 2019, the market was under pressure in the first half of the year, but from August onwards, the spot retraced back up. If the bulls keep AUD/USD above the 0.6700 handle, the year 2020 could be sideways to up.
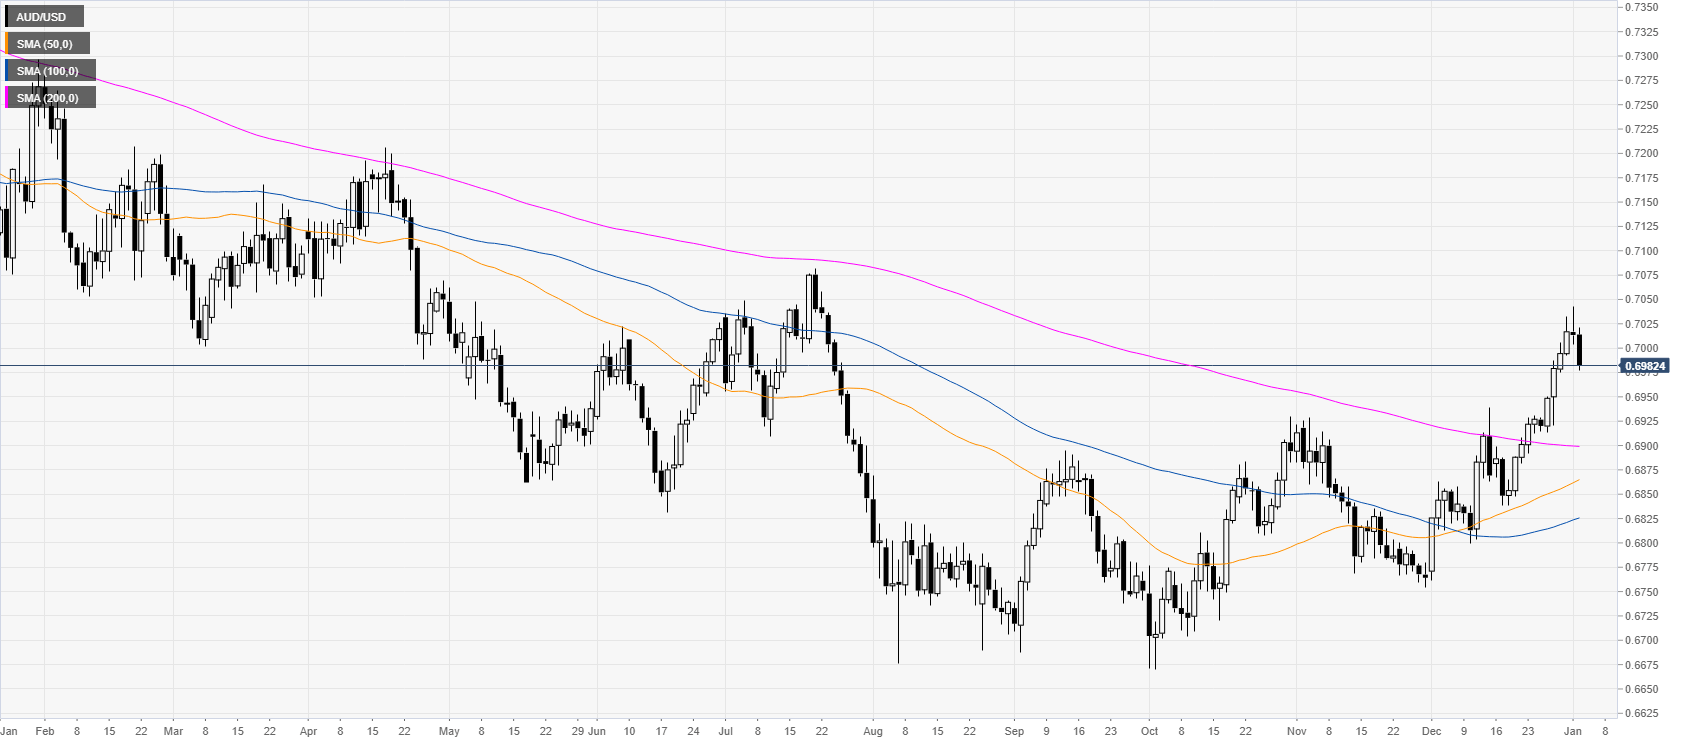
 

AUD/USD daily chart 

 
AUD/USD is retracing down below the 0.7000 handle while trading above the main simple moving averages (SMAs), suggesting an underlying bullish tone.


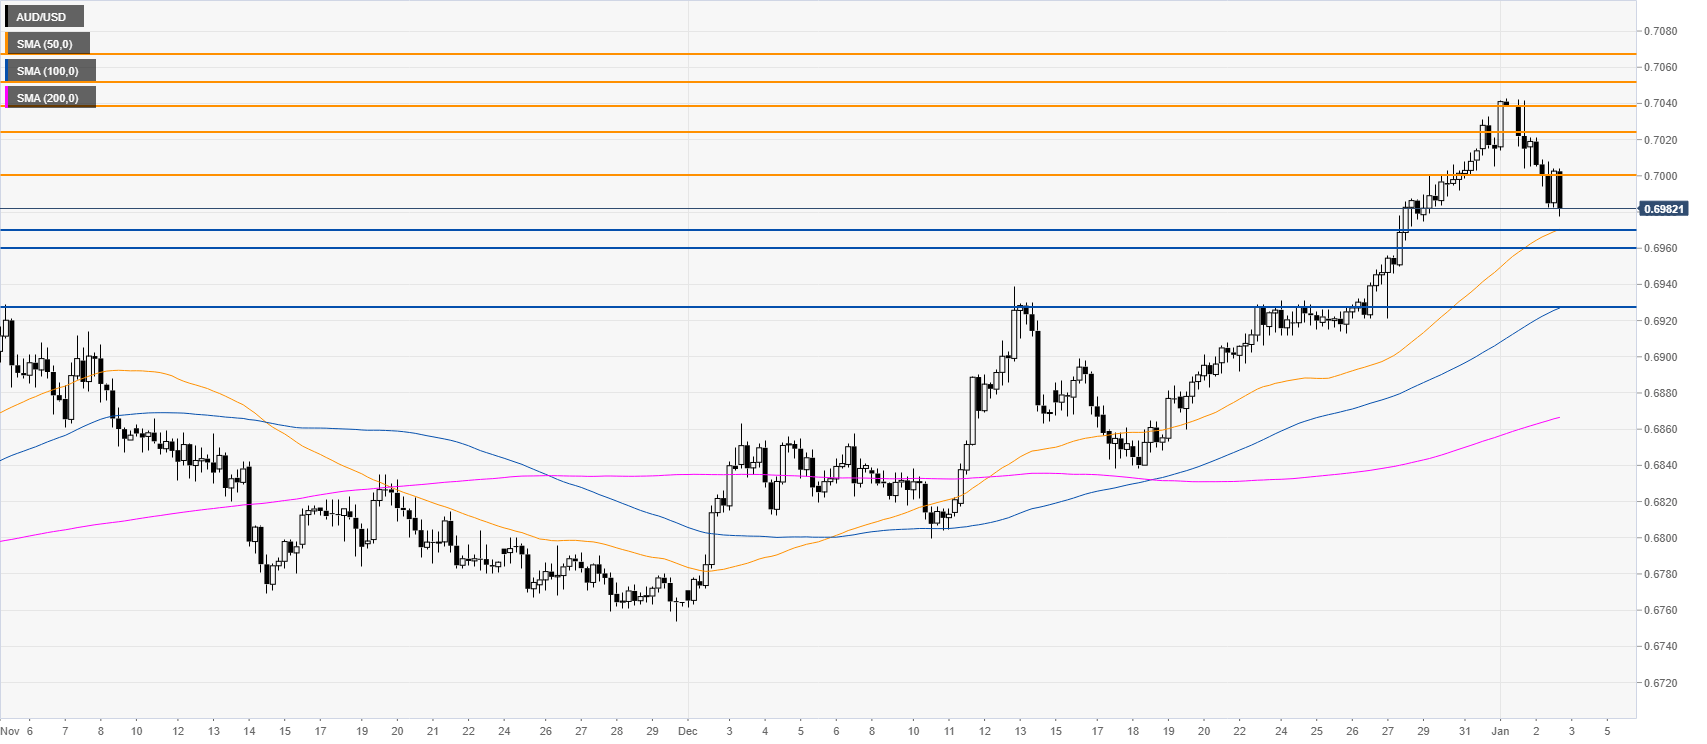
AUD/USD four-hour chart

 
The market is nearing the 50 SMA. The buyers will need to reclaim the 0.7000 resistance if they intend to test the 0.7039 and 0.7053 resistances. However, if bears manage to pierce the 0.6970/0.6959 price zone, the market could extend the correction towards the 0.6929 level, according to the Technical Confluences Indicator
 

Additional key levels

AUD/USD

Overview
Today last price0.6982
Today Daily Change-0.0032
Today Daily Change %-0.46
Today daily open0.7014
 
Trends
Daily SMA200.6904
Daily SMA500.6862
Daily SMA1000.6824
Daily SMA2000.69
 
Levels
Previous Daily High0.7043
Previous Daily Low0.7004
Previous Weekly High0.6987
Previous Weekly Low0.6892
Previous Monthly High0.7033
Previous Monthly Low0.6762
Daily Fibonacci 38.2%0.7019
Daily Fibonacci 61.8%0.7028
Daily Pivot Point S10.6997
Daily Pivot Point S20.6981
Daily Pivot Point S30.6958
Daily Pivot Point R10.7036
Daily Pivot Point R20.7059
Daily Pivot Point R30.7075

Author

Flavio Tosti

Flavio Tosti

Independent Analyst


More from Flavio Tosti
Share:

Editor's Picks

EUR/USD stays well offered below 1.1800

The selling pressure on EUR/USD is picking up pace, with the pair slipping decisively below the key 1.1800 level and sliding to fresh two week lows as Wednesday’s session draws to a close. The move lower comes as the US Dollar finds renewed strength after the latest round of US data and the release of the FOMC Minutes. Next of note on the docket will be the US weekly Initial Jobless Claims.
 

GBP/USD reaches multi-day lows near 1.3500

GBP/USD reverses its initial upside momentum and is now adding to previous declines, approaching the 1.3500 region on Wednesday. Cable’s downtick comes on the back of decent gains in the Greenback and easing UK inflation figures, which seem to have reinforced the case for a BoE rate cut in March.

Gold battle to regain $5,000 continues

Gold is back on the front foot on Wednesday, shaking off part of the early week softness and challenging two-day highs near the $5,000 mark per troy ounce. The move comes ahead of the FOMC Minutes and is unfolding despite an intense rebound in the US Dollar.

Australia unemployment rate set to edge up within overall strong labor market

The Australian monthly employment report is scheduled for release on Thursday at 00:30 GMT, and market participants anticipate a modest increase in jobs in January. The Australian Bureau of Statistics is expected to announce that the country added 20K new jobs in the month, while the Unemployment Rate is forecast at 4.2%, up from the 4.1% posted in December.

Mixed UK inflation data no gamechanger for the Bank of England

Food inflation plunged in January, but service sector price pressure is proving stickier. We continue to expect Bank of England rate cuts in March and June. The latest UK inflation read is a mixed bag for the Bank of England, but we doubt it drastically changes the odds of a March rate cut.

Sui extends sideways action ahead of Grayscale’s GSUI ETF launch

Sui is extending its downtrend for the second consecutive day, trading at 0.95 at the time of writing on Wednesday. The Layer-1 token is down over 16% in February and approximately 34% from the start of the year, aligning with the overall bearish sentiment across the crypto market.