|

AUD/USD explodes to test 0.7650 on hawkish RBA, bull pennant

  • AUD/USD holds the higher ground, rising over a big figure on RBA’s hawkish surprise.
  • The US dollar eases amid a better market mood, supporting the aussie pair.
  • Bull pennant breakout on the 1D chart on Monday justifies the explosion.

AUD/USD is sitting at the highest level since June 2021, eyeing a test of the 0.7650 barrier, as the buying interest around the aussie dollar remains unabated on the RBA’s hawkish pivot.

The RBA, at its April monetary policy meeting, kept the key rate unchanged at 0.10%, as widely expected. But what the trick for aussie bulls was the change in the central bank’s forward guidance, as it dropped its ‘patient’ pledge on the inflation developments, hinting at a potential rate hike in the upcoming meetings.

Further, the Russia-Ukraine crisis-driven surge in oil prices combined with holiday-thinned trading exaggerated the move higher in the major.

Meanwhile, the US dollar trades on the defensive amid a better market mood, despite looming risks of additional Western sanctions and penalties.

Next of relevance for the aussie remains the US ISM Services PMI and Fedspeak while the UN Security Council meeting will be also closely followed.

Technically, AUD/USD has extended the upside breakout from a bull pennant confirmed on Monday.

The pattern got validated after the pair closed Monday above the falling trendline resistance at 0.7519.

AUD/USD: Daily chart

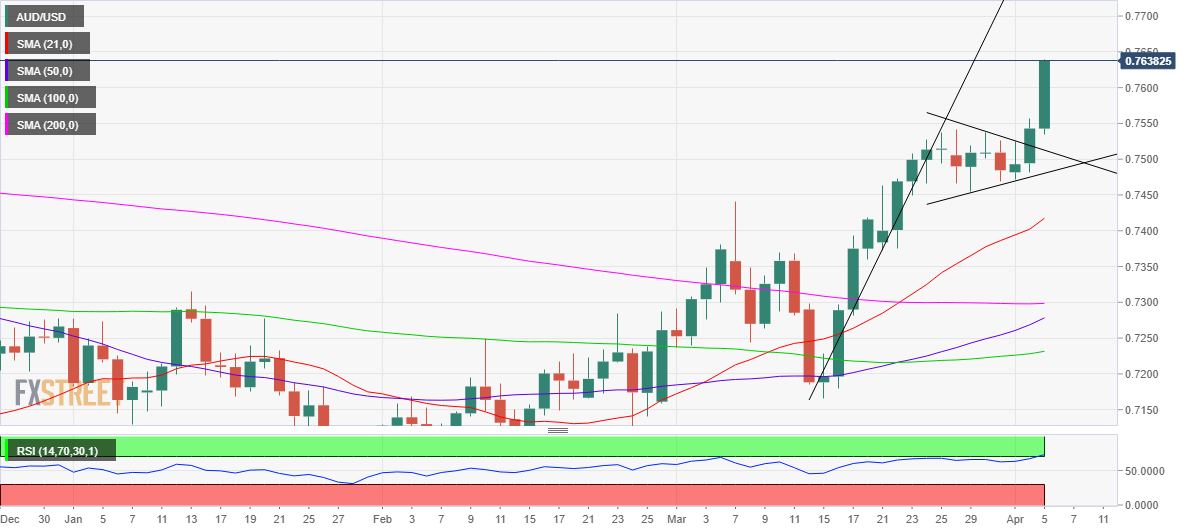
AUD bulls remain poised for the further upside towards 0.7700, although the 14-day Relative Strength Index (RSI) is peeping into the overbought region, warranting caution.

Therefore, a minor pullback cannot be ruled before the major resumes the next uptrend.

Tuesday’s low of 0.7535 could emerge as powerful support, below which the 0.7500 level could be tested should the retracement gain momentum.

AUD/USD: Additional levels to consider

AUD/USD

Overview
Today last price0.7638
Today Daily Change0.0096
Today Daily Change %1.27
Today daily open0.7543
 
Trends
Daily SMA200.7406
Daily SMA500.7269
Daily SMA1000.7228
Daily SMA2000.7298
 
Levels
Previous Daily High0.7557
Previous Daily Low0.7482
Previous Weekly High0.7541
Previous Weekly Low0.7455
Previous Monthly High0.7541
Previous Monthly Low0.7165
Daily Fibonacci 38.2%0.7528
Daily Fibonacci 61.8%0.7511
Daily Pivot Point S10.7498
Daily Pivot Point S20.7452
Daily Pivot Point S30.7423
Daily Pivot Point R10.7573
Daily Pivot Point R20.7602
Daily Pivot Point R30.7648

Author

Dhwani Mehta

Dhwani Mehta

FXStreet

Residing in Mumbai (India), Dhwani is a Senior Analyst and Manager of the Asian session at FXStreet. She has over 10 years of experience in analyzing and covering the global financial markets, with specialization in Forex and commodities markets.

More from Dhwani Mehta
Share:

Editor's Picks

EUR/USD treads water above 1.1850 amid thin trading

EUR/USD stays defensive but holds 1.1850 amid quiet markets in the European hours on Monday.  The US Dollar is struggling for direction due to thin liquidity conditions as US markets are closed in observance of Presidents' Day. 

GBP/USD flat lines as traders await key UK and US macro data

GBP/USD kicks off a new week on a subdued note and oscillates in a narrow range near 1.365 in Monday's European trading. The mixed fundamental backdrop warrants some caution for aggressive traders as the market focus now shifts to this week's important releases from the UK and the US.

Gold sticks to intraday losses; lacks follow-through

Gold remains depressed through the early European session on Monday, though it has managed to rebound from the daily trough and currently trades around the $5,000 psychological mark. Moreover, a combination of supporting factors warrants some caution for aggressive bearish traders, and before positioning for deeper losses.

Bitcoin, Ethereum and Ripple consolidate within key ranges as selling pressure eases

Bitcoin and Ethereum prices have been trading sideways within key ranges following the massive correction. Meanwhile, XRP recovers slightly, breaking above the key resistance zone. The top three cryptocurrencies hint at a potential short-term recovery, with momentum indicators showing fading bearish signs.

Global inflation watch: Signs of cooling services inflation

Realized inflation landed close to expectations in January, as negative base effects weighed on the annual rates. Remaining sticky inflation is largely explained by services, while tariff-driven goods inflation remains limited even in the US.

Monero Price Forecast: XMR risks a drop below $300 under mounting bearish pressure

Monero (XMR) starts the week under pressure, recording a 4% decline at press time on Monday after a 7% drop the previous day, putting the $300 support zone in focus.