AUD/NZD Price Analysis: Bullish momentum, buyers don't give up
- AUD/NZD was seen around the upper end of its daily range on Friday.
- The pair maintains a bullish outlook supported by short-term trend signals.
- Technicals show mixed bias across indicators, with resistance seen above and long-term averages still pressuring.

AUD/NZD is displaying upward momentum ahead on Friday’s session, trading near the top of its daily range and not far from the 1.0800 zone. The pair has gained on the day, extending its bullish push while short-term indicators strengthen this outlook. A buy signal from the MACD and support from short-term moving averages help confirm the bias, although some indicators like the RSI and Stochastic remain neutral. Traders should be mindful that longer-term SMAs continue to show downside risk.
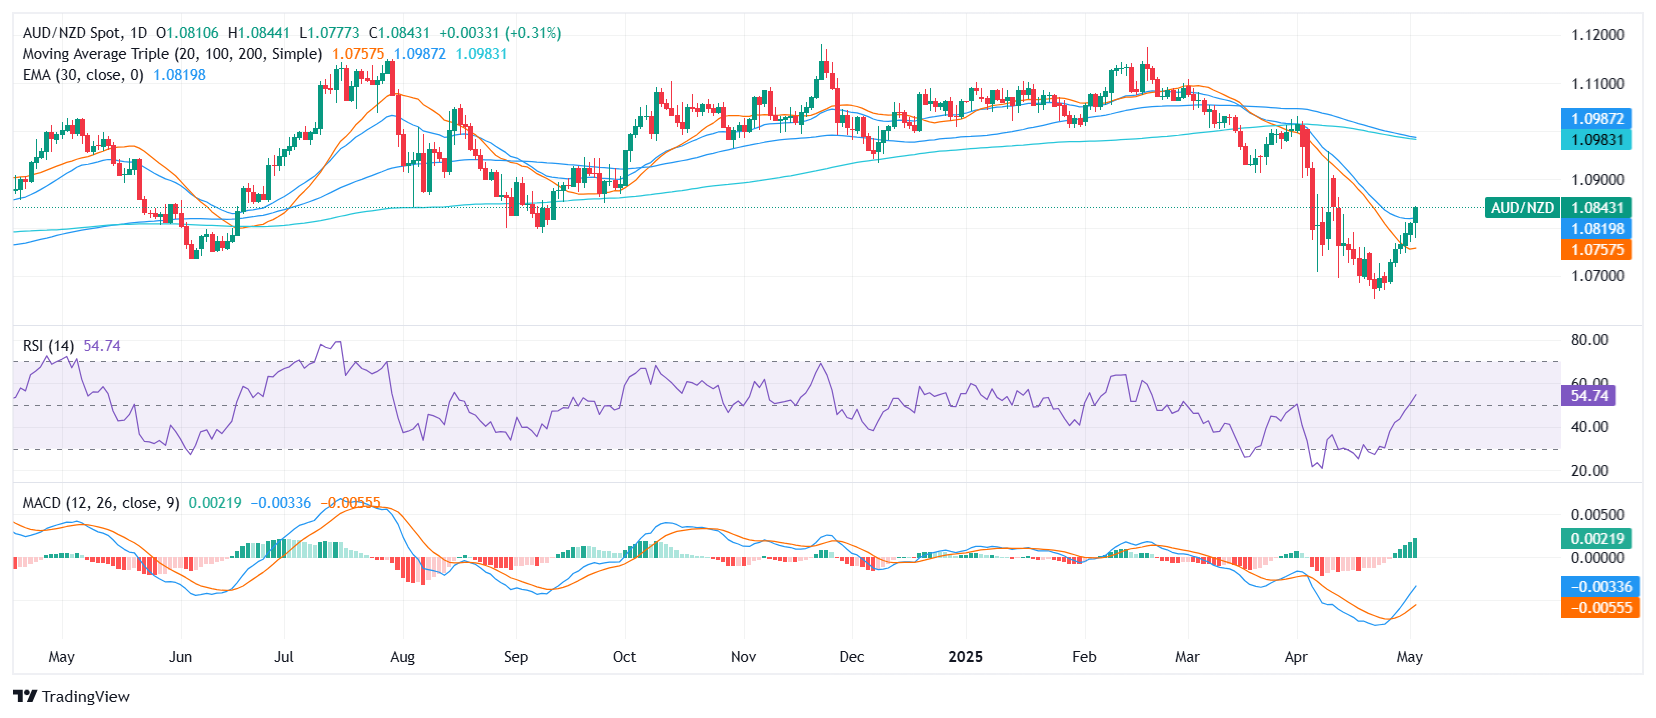
AUD/NZD maintains a bullish tone as price action presses higher. The Moving Average Convergence Divergence (MACD) has turned positive, suggesting momentum is shifting in favor of buyers. Meanwhile, the 10-day Exponential Moving Average and the 10-day Simple Moving Average have both turned supportive, aligning below current prices. The 20-day SMA also leans bullish, helping sustain short-term upside momentum.
However, the Relative Strength Index (RSI) hovers near the neutral 50 mark, while the Bull Bear Power and Stochastic Oscillator also offer limited directional bias. This mixed signal set may keep some traders cautious. Notably, the 100-day and 200-day SMAs remain positioned above current price levels, signaling that broader trends have yet to confirm the recent strength.
Immediate resistance lies at 1.0874, followed by stronger zones at 1.0908 and 1.0936. On the downside, initial support is found at 1.0842, with subsequent levels at 1.0833 and 1.0830. A break above resistance would signal continuation of the bullish trend, but failure to clear those zones may invite short-term pullbacks.
Daily chart
Author

Patricio Martín
FXStreet
Patricio is an economist from Argentina passionate about global finance and understanding the daily movements of the markets.


