|

AUD/NZD Price Analysis: Bearish signals deepen as Aussie struggles against Kiwi

  • AUD/NZD trades near the 1.0700 area, retreating from intraday highs ahead of the Asian session.
  • Overall bearish sentiment persists despite neutral oscillators, with all key moving averages pointing to downside pressure.
  • Support lies at 1.06949, while resistance levels are seen at 1.07691, 1.07711, and 1.08238.

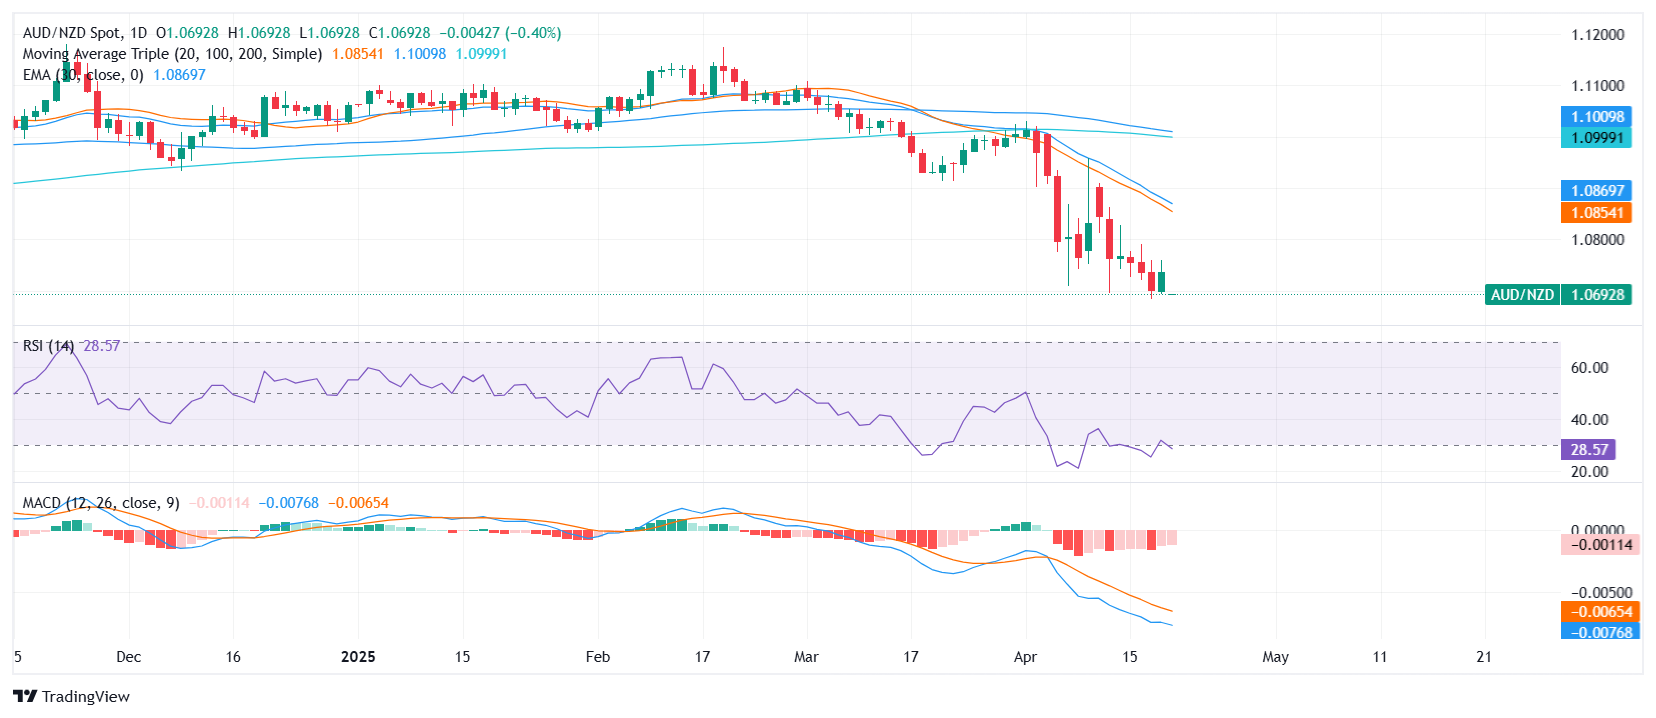
The AUD/NZD pair is exhibiting bearish signals, currently trading around 1.0700, down 0.40% today, and positioned mid-range between 1.06784 and 1.07439 during Monday’s session. The pair's inability to hold higher ground underlines the weight of selling pressure as the broader trend continues to favor the downside.

Momentum indicators provide mixed but cautious readings. The Relative Strength Index (RSI) stands at 31, close to oversold territory yet still holding a neutral bias. The Moving Average Convergence Divergence (MACD) continues to flash a sell signal, in alignment with the Awesome Oscillator at -0.0185, which also suggests downside continuation. Meanwhile, the Stochastic %K at 9.2611 remains neutral, lacking clear directional conviction.

The moving averages confirm the bearish technical structure. All key SMAs — 20-day at 1.0859, 100-day at 1.1010, and 200-day at 1.1000 — are sloping downward, along with shorter-term indicators like the 10-day EMA at 1.0769 and 10-day SMA at 1.0771, which further validate the dominant bearish bias.

Support is found at 1.06949. Resistance is capped at 1.07691, followed by 1.07711 and 1.08238. If selling continues and the pair slips below the 1.0690 zone, a fresh wave of downside could be triggered.

Daily chart

Author

Patricio Martín

Patricio is an economist from Argentina passionate about global finance and understanding the daily movements of the markets.

More from Patricio Martín
Share:

Editor's Picks

AUD/USD eyes 0.7150 barrier nine-day EMA

AUD/USD inches higher after registering modest losses in the previous day, trading around 0.7130 during the Asian hours. The technical analysis of the daily chart indicates that the pair is moving sideways within the rectangle pattern, suggesting a consolidation as neither the bulls nor the bears have enough momentum to take control of the market.

USD/JPY trades below 160.00 intervention threshold; bullish bias intact

The USD/JPY pair attracts some sellers during the Asian session amid fears that authorities will step in again to prop up the Japanese Yen. Furthermore, the Israel-Lebanon truce prompts some profit-taking around the US Dollar and exerts downward pressure on the currency pair.

Gold rebounds from one-week low as Israel-Lebanon truce pressures safe-haven USD

Gold gains some positive traction on Thursday and climbs to the $4,475 area during the Asian session, reversing a major part of the previous day's slide to a one-week low. The Israel-Lebanon truce prompts some profit-taking around the US Dollar and supports the commodity. 


Hyperliquid: ETF demand, capital rotation fuel HYPE rally as Bitcoin melts

Hyperliquid price sustains an upward trend near its all-time high of $75.76 on Thursday after posting 80% gains in May, while Bitcoin (BTC) retraces below $65,000, triggering a market-wide panic.

Kevin Warsh takes the Fed helm: What it means for the US Dollar
The Federal Reserve moves away from the highly predictable "forward guidance" model of the Jerome Powell era to a new “Kevin Warsh environment”, characterized by less communication, more policy surprises, and an increased focus on the Fed's complex balance sheet.
Recession on paper: What really moves the Canadian Loonie now?

Statistics Canada handed the headline writers a gift and the analysts a headache. Real GDP shrank 0.1% on an annualized basis in the first quarter, and with the fourth quarter of 2025 revised down to a 1.0% contraction, that is two negative quarters in a row, the textbook definition of a technical recession and Canada's first since the pandemic.