|

AUD/NZD Price Analysis: Aussie stalls near 1.0800 as bearish pressure builds

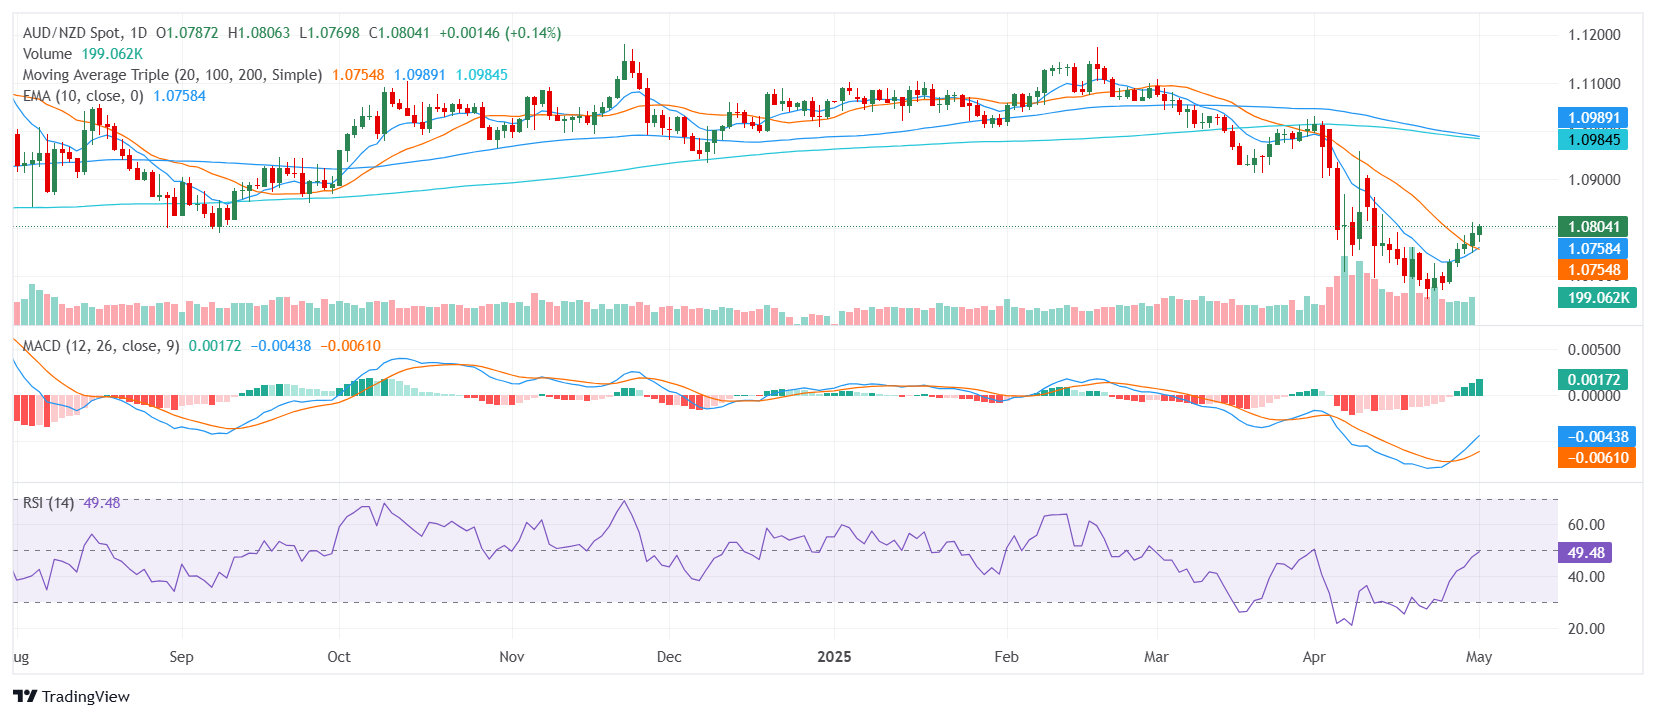
  • AUD/NZD trades around the 1.0800 zone after modest gains ahead of the Asian session.
  • Bearish bias holds despite short-term momentum stabilizing.
  • Key moving averages above price reinforce resistance, while support remains close below.

The AUD/NZD pair edged slightly higher on Thursday, trading near the 1.0800 area as the market transitions into the Asian session. While the move shows mild intraday strength, the broader technical setup remains tilted to the downside. Mixed signals from short-term indicators clash with the clearly defined bearish structure shaped by longer-term trendlines and overhead resistance.

Technically, AUD/NZD is flashing a bearish signal. The Moving Average Convergence Divergence currently gives a soft buy signal, while the Relative Strength Index remains neutral just below the 50 line. The Stochastic RSI Fast and Average Directional Index are also neutral, indicating that despite the day’s gains, momentum remains capped and trend conviction limited.

The bearish outlook is underpinned by the configuration of key moving averages. Both the 30-day Exponential and Simple Moving Averages are positioned above the current price, capping any upward extension. More significantly, the 100-day and 200-day SMAs — aligned near the 1.0990 area — add longer-term resistance to the structure. The only supportive element comes from the 20-day SMA, which offers a soft floor just beneath current levels, but lacks the weight to counter the broader trend.

Immediate support is located at 1.0784, 1.0776, and 1.0760. Resistance awaits at 1.0804, 1.0820, and 1.0833.

Daily Chart

Author

Patricio Martín

Patricio is an economist from Argentina passionate about global finance and understanding the daily movements of the markets.

More from Patricio Martín
Share:

Editor's Picks

AUD/USD eyes 0.7150 barrier nine-day EMA

AUD/USD inches higher after registering modest losses in the previous day, trading around 0.7130 during the Asian hours. The technical analysis of the daily chart indicates that the pair is moving sideways within the rectangle pattern, suggesting a consolidation as neither the bulls nor the bears have enough momentum to take control of the market.

USD/JPY trades below 160.00 intervention threshold; bullish bias intact

The USD/JPY pair attracts some sellers during the Asian session amid fears that authorities will step in again to prop up the Japanese Yen. Furthermore, the Israel-Lebanon truce prompts some profit-taking around the US Dollar and exerts downward pressure on the currency pair.

Gold rebounds from one-week low as Israel-Lebanon truce pressures safe-haven USD

Gold gains some positive traction on Thursday and climbs to the $4,475 area during the Asian session, reversing a major part of the previous day's slide to a one-week low. The Israel-Lebanon truce prompts some profit-taking around the US Dollar and supports the commodity. 


Hyperliquid: ETF demand, capital rotation fuel HYPE rally as Bitcoin melts

Hyperliquid price sustains an upward trend near its all-time high of $75.76 on Thursday after posting 80% gains in May, while Bitcoin (BTC) retraces below $65,000, triggering a market-wide panic.

Kevin Warsh takes the Fed helm: What it means for the US Dollar
The Federal Reserve moves away from the highly predictable "forward guidance" model of the Jerome Powell era to a new “Kevin Warsh environment”, characterized by less communication, more policy surprises, and an increased focus on the Fed's complex balance sheet.
Recession on paper: What really moves the Canadian Loonie now?

Statistics Canada handed the headline writers a gift and the analysts a headache. Real GDP shrank 0.1% on an annualized basis in the first quarter, and with the fourth quarter of 2025 revised down to a 1.0% contraction, that is two negative quarters in a row, the textbook definition of a technical recession and Canada's first since the pandemic.