|

AUD/NZD Price Analysis: Aussie pressured near mid-1.0800s as long-term trend weakens

  • AUD/NZD moves around the mid-1.0800s ahead of Asia after a mild pullback.
  • Overall sentiment leans bearish despite mixed intraday indicators.
  • Longer-term trend lines tilt lower, with key resistance levels capping upside.

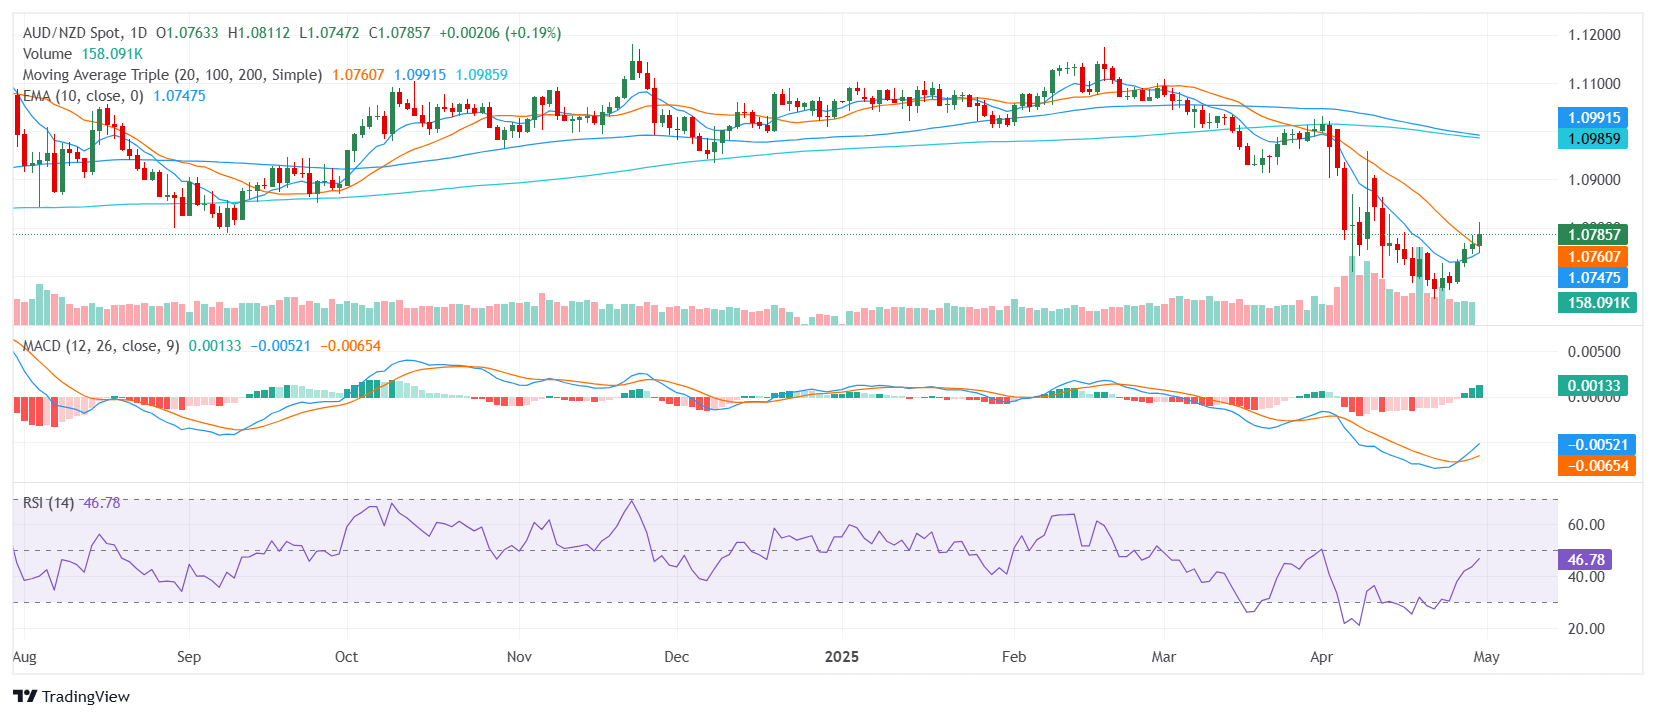
The AUD/NZD pair is trading with a slight downside bias on Wednesday as it hovers near the mid-1.0800s, showing mild losses for the day ahead of the Asian session. While short-term signals such as the MACD offer tentative support and the RSI stays neutral, the broader picture remains pressured by a bearish trend, reinforced by declining longer-term moving averages. The pair is trading mid-range and struggling to break through overhead resistance, reflecting underlying softness in momentum.

Technically, the AUD/NZD maintains a bearish outlook. The Relative Strength Index is neutral near 47, indicating a lack of conviction on either side. The MACD, however, provides a modest buy signal, which contrasts with the overall structure shaped by the moving averages. The Stochastic RSI is elevated but neutral, while the Average Directional Index sits above 35, suggesting the existing trend has strength, though directionality remains unclear in the short term.

The bearish bias is underpinned by the positioning of key moving averages. The 30-day Exponential and Simple Moving Averages — both sitting above current levels — are aligned with the downward tilt of the 100-day and 200-day SMAs, reinforcing resistance. The 20-day SMA is the lone short-term signal supporting buyers, but it lacks broader confirmation.

Immediate support levels are noted at 1.0783, 1.0776, and 1.0760. Resistance is capped at 1.0801, followed by 1.0819 and 1.0833.

Daily Chart

Author

Patricio Martín

Patricio is an economist from Argentina passionate about global finance and understanding the daily movements of the markets.

More from Patricio Martín
Share:

Editor's Picks

EUR/USD stays near 1.1650 with fading momentum

EUR/USD holds ground after five days of losses, trading around 1.1650 during the Asian hours on Friday. The 14-day Relative Strength Index momentum indicator at 39 trends lower, confirming fading momentum rather than oversold conditions.

GBP/USD remains below 1.3450, nine-day EMA

GBP/USD remains subdued for the fourth consecutive day, trading around 1.3430 during the Asian hours on Friday. The momentum indicator 14-day Relative Strength Index at 51.9 is neutral, reflecting slower momentum after firm recent readings. An RSI drop back beneath 50 would strengthen the case for a deeper pullback.

Gold edges lower as USD preserves its recent gains ahead of US NFP report

Gold struggles to capitalize on the previous day's goodish rebound from the vicinity of the $4,400 mark and attracts fresh sellers during the Asian session on Friday. The US Dollar preserves its gains registered over the past two weeks and touches a nearly one-month high, undermining the commodity. 

Bitcoin, Ethereum and Ripple find key support, reviving rally hopes

Bitcoin, Ethereum, and Ripple steadied above key support levels on Friday after being rejected at mid-week resistance zones. The short-term recovery prospects remain intact if the top three cryptocurrencies by market capitalization hold these support zones.

2026 economic outlook: Clear skies but don’t unfasten your seatbelts yet

Most years fade into the background as soon as a new one starts. Not 2025: a year of epochal shifts, in which the macroeconomy was the dog that did not bark. What to expect in 2026? The shocks of 2025 will not be undone, but neither will they be repeated.

Pepe Price Forecast: PEPE risks 100-day EMA fallout as bullish interest fades

Pepe is under extreme selling pressure, trading in the red for the fifth consecutive day, down 1% at press time on Friday. Pepe’s decline following a 72% hike last week suggests a likely profit-booking phase, while on-chain data indicates declining network activity.