|

AUD/NZD Price Analysis: Aussie drifts near 1.0800 as bullish structure faces mixed signals

  • AUD/NZD trades near the 1.0800 zone after a muted Monday session ahead of Asia.
  • Bias remains bullish overall, but short-term momentum indicators are divided.
  • Dynamic support holds below while key resistance from long-term averages caps upside.

The AUD/NZD pair hovered around the 1.0800 mark on Monday after the European session, slipping slightly but staying within a narrow mid-range as the market heads into Asia. While price action has remained steady, the technical landscape presents a mix of signals — with a bullish structure underpinned by rising short-term averages, yet some indicators showing emerging pressure.

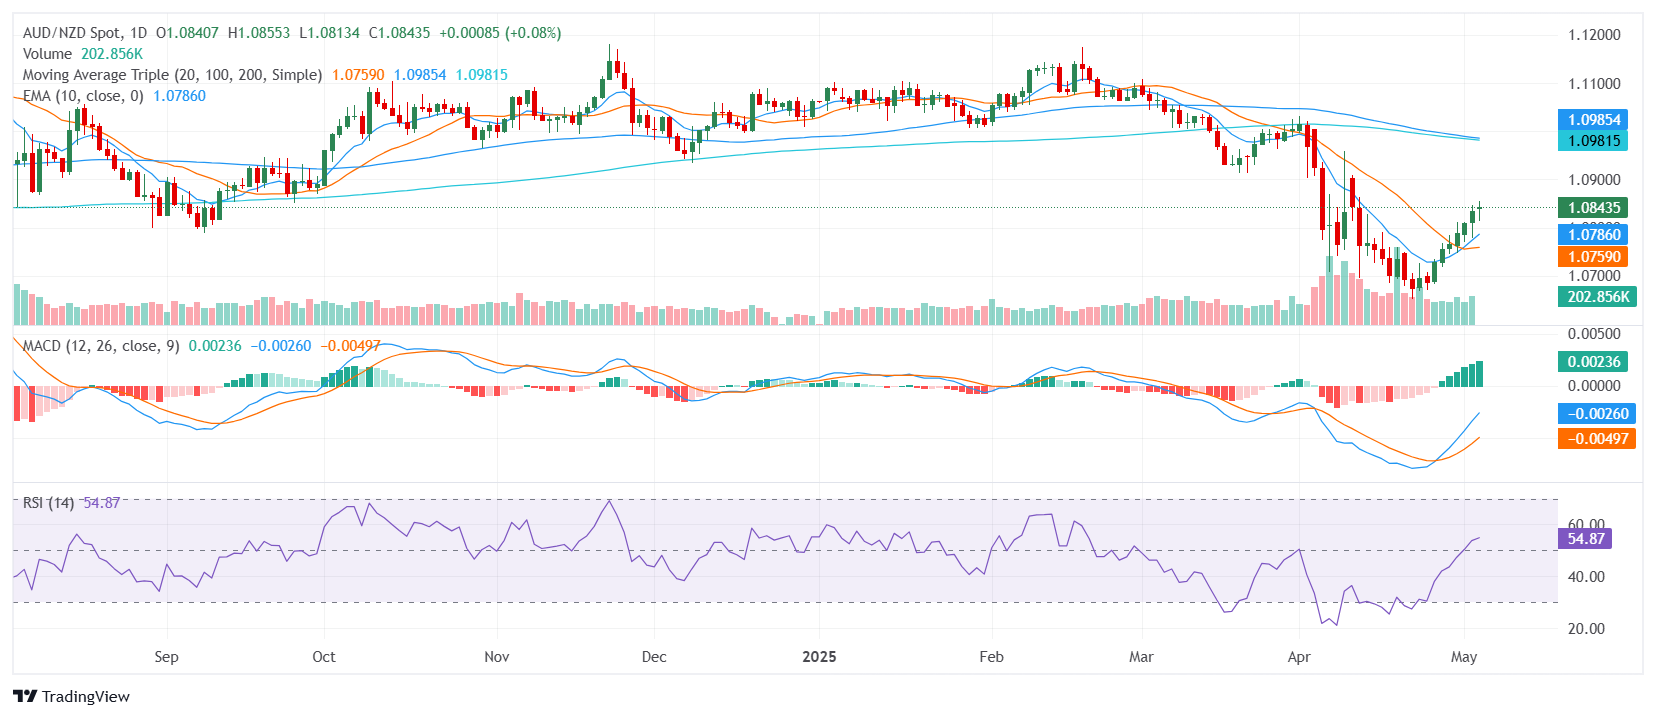
From a momentum standpoint, the outlook is conflicted. The Relative Strength Index holds a neutral stance near 54, suggesting a balanced market. The Moving Average Convergence Divergence continues to flash a buy signal, pointing to latent upward momentum. However, the Bull Bear Power and Williams Percent Range have turned negative, indicating that intraday strength may be waning.

Structurally, the bullish case is still intact. The 10-day Exponential and Simple Moving Averages, along with the 20-day SMA, all sit below current levels and are pointing upward — helping to maintain directional support. That said, longer-term resistance looms overhead, with both the 100-day and 200-day Simple Moving Averages positioned well above, limiting scope for sustained rallies unless broken decisively.

Support levels are identified at 1.0826, 1.0823, and 1.0796. Resistance aligns at 1.0842, 1.0853, and 1.0873. Traders may watch for consolidation within this zone unless a catalyst breaks the pair out of its current range.

Daily Chart

Author

Patricio Martín

Patricio is an economist from Argentina passionate about global finance and understanding the daily movements of the markets.

More from Patricio Martín
Share:

Editor's Picks

AUD/USD eyes 0.7150 barrier nine-day EMA

AUD/USD inches higher after registering modest losses in the previous day, trading around 0.7130 during the Asian hours. The technical analysis of the daily chart indicates that the pair is moving sideways within the rectangle pattern, suggesting a consolidation as neither the bulls nor the bears have enough momentum to take control of the market.

USD/JPY trades below 160.00 intervention threshold; bullish bias intact

The USD/JPY pair attracts some sellers during the Asian session amid fears that authorities will step in again to prop up the Japanese Yen. Furthermore, the Israel-Lebanon truce prompts some profit-taking around the US Dollar and exerts downward pressure on the currency pair.

Gold rebounds from one-week low as Israel-Lebanon truce pressures safe-haven USD

Gold gains some positive traction on Thursday and climbs to the $4,475 area during the Asian session, reversing a major part of the previous day's slide to a one-week low. The Israel-Lebanon truce prompts some profit-taking around the US Dollar and supports the commodity. 


Hyperliquid: ETF demand, capital rotation fuel HYPE rally as Bitcoin melts

Hyperliquid price sustains an upward trend near its all-time high of $75.76 on Thursday after posting 80% gains in May, while Bitcoin (BTC) retraces below $65,000, triggering a market-wide panic.

Kevin Warsh takes the Fed helm: What it means for the US Dollar
The Federal Reserve moves away from the highly predictable "forward guidance" model of the Jerome Powell era to a new “Kevin Warsh environment”, characterized by less communication, more policy surprises, and an increased focus on the Fed's complex balance sheet.
Recession on paper: What really moves the Canadian Loonie now?

Statistics Canada handed the headline writers a gift and the analysts a headache. Real GDP shrank 0.1% on an annualized basis in the first quarter, and with the fourth quarter of 2025 revised down to a 1.0% contraction, that is two negative quarters in a row, the textbook definition of a technical recession and Canada's first since the pandemic.