|

AUD/NZD Price Analysis: Bearish signals emerge ahead of Asia open

  • AUD/NZD was seen trading around the 1.07 area, registering a slight decline on the day.
  • The overall technical outlook suggests a bearish bias for the currency pair.
  • Key Simple Moving Averages point to selling pressure, while the Relative Strength Index remains neutral, and the Moving Average Convergence Divergence shows a buy signal.

The AUD/NZD has experienced some downward pressure, hovering near the 1.07 zone on Tuesday. Despite mixed signals from some momentum indicators, the longer-term technical picture appears to favor the bears, with several moving averages reinforcing this sentiment.

The AUD/NZD pair is currently exhibiting a bearish technical bias. While the Moving Average Convergence Divergence indicator is flashing a buy signal, suggesting potential short-term upward momentum, the broader context leans negative. The Relative Strength Index sits in neutral territory around the 42 level, offering little directional conviction at present. However, both the 20-day, 100-day, and 200-day Simple Moving Averages are indicating sell positions, highlighting sustained bearish momentum over different timeframes. Similarly, the 30-day Exponential Moving Average and Simple Moving Average also point towards further declines.

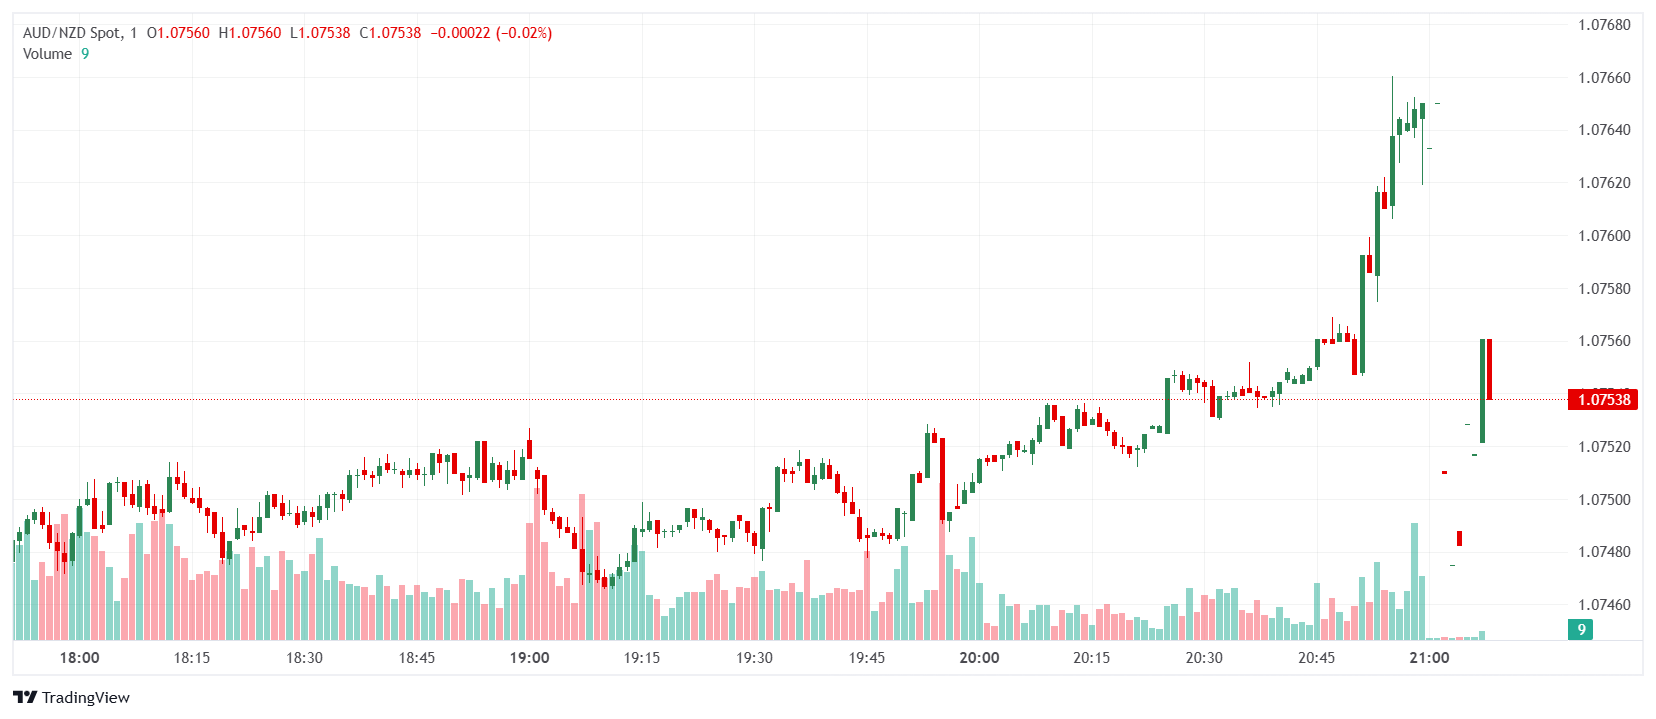
Looking at potential price movements, immediate support is observed at 1.0746, followed by 1.0739 and then a lower level at 1.0717. On the upside, initial resistance can be found at 1.0774, with subsequent resistance levels at 1.0781 and 1.0786.

Daily chart

Author

Patricio Martín

Patricio is an economist from Argentina passionate about global finance and understanding the daily movements of the markets.

More from Patricio Martín
Share:

Editor's Picks

AUD/USD eyes 0.7150 barrier nine-day EMA

AUD/USD inches higher after registering modest losses in the previous day, trading around 0.7130 during the Asian hours. The technical analysis of the daily chart indicates that the pair is moving sideways within the rectangle pattern, suggesting a consolidation as neither the bulls nor the bears have enough momentum to take control of the market.

USD/JPY trades below 160.00 intervention threshold; bullish bias intact

The USD/JPY pair attracts some sellers during the Asian session amid fears that authorities will step in again to prop up the Japanese Yen. Furthermore, the Israel-Lebanon truce prompts some profit-taking around the US Dollar and exerts downward pressure on the currency pair.

Gold rebounds from one-week low as Israel-Lebanon truce pressures safe-haven USD

Gold gains some positive traction on Thursday and climbs to the $4,475 area during the Asian session, reversing a major part of the previous day's slide to a one-week low. The Israel-Lebanon truce prompts some profit-taking around the US Dollar and supports the commodity. 


Hyperliquid: ETF demand, capital rotation fuel HYPE rally as Bitcoin melts

Hyperliquid price sustains an upward trend near its all-time high of $75.76 on Thursday after posting 80% gains in May, while Bitcoin (BTC) retraces below $65,000, triggering a market-wide panic.

Kevin Warsh takes the Fed helm: What it means for the US Dollar
The Federal Reserve moves away from the highly predictable "forward guidance" model of the Jerome Powell era to a new “Kevin Warsh environment”, characterized by less communication, more policy surprises, and an increased focus on the Fed's complex balance sheet.
Recession on paper: What really moves the Canadian Loonie now?

Statistics Canada handed the headline writers a gift and the analysts a headache. Real GDP shrank 0.1% on an annualized basis in the first quarter, and with the fourth quarter of 2025 revised down to a 1.0% contraction, that is two negative quarters in a row, the textbook definition of a technical recession and Canada's first since the pandemic.