|

AUD/JPY Technical Analysis: Remains trapped inside of last week's range

  • The AUD/JPY is trading tersely near 82.50 after Monday's bearish gap leaves the pair hobbled within Friday's trading range.

AUD/JPY Chart, 5-Minute

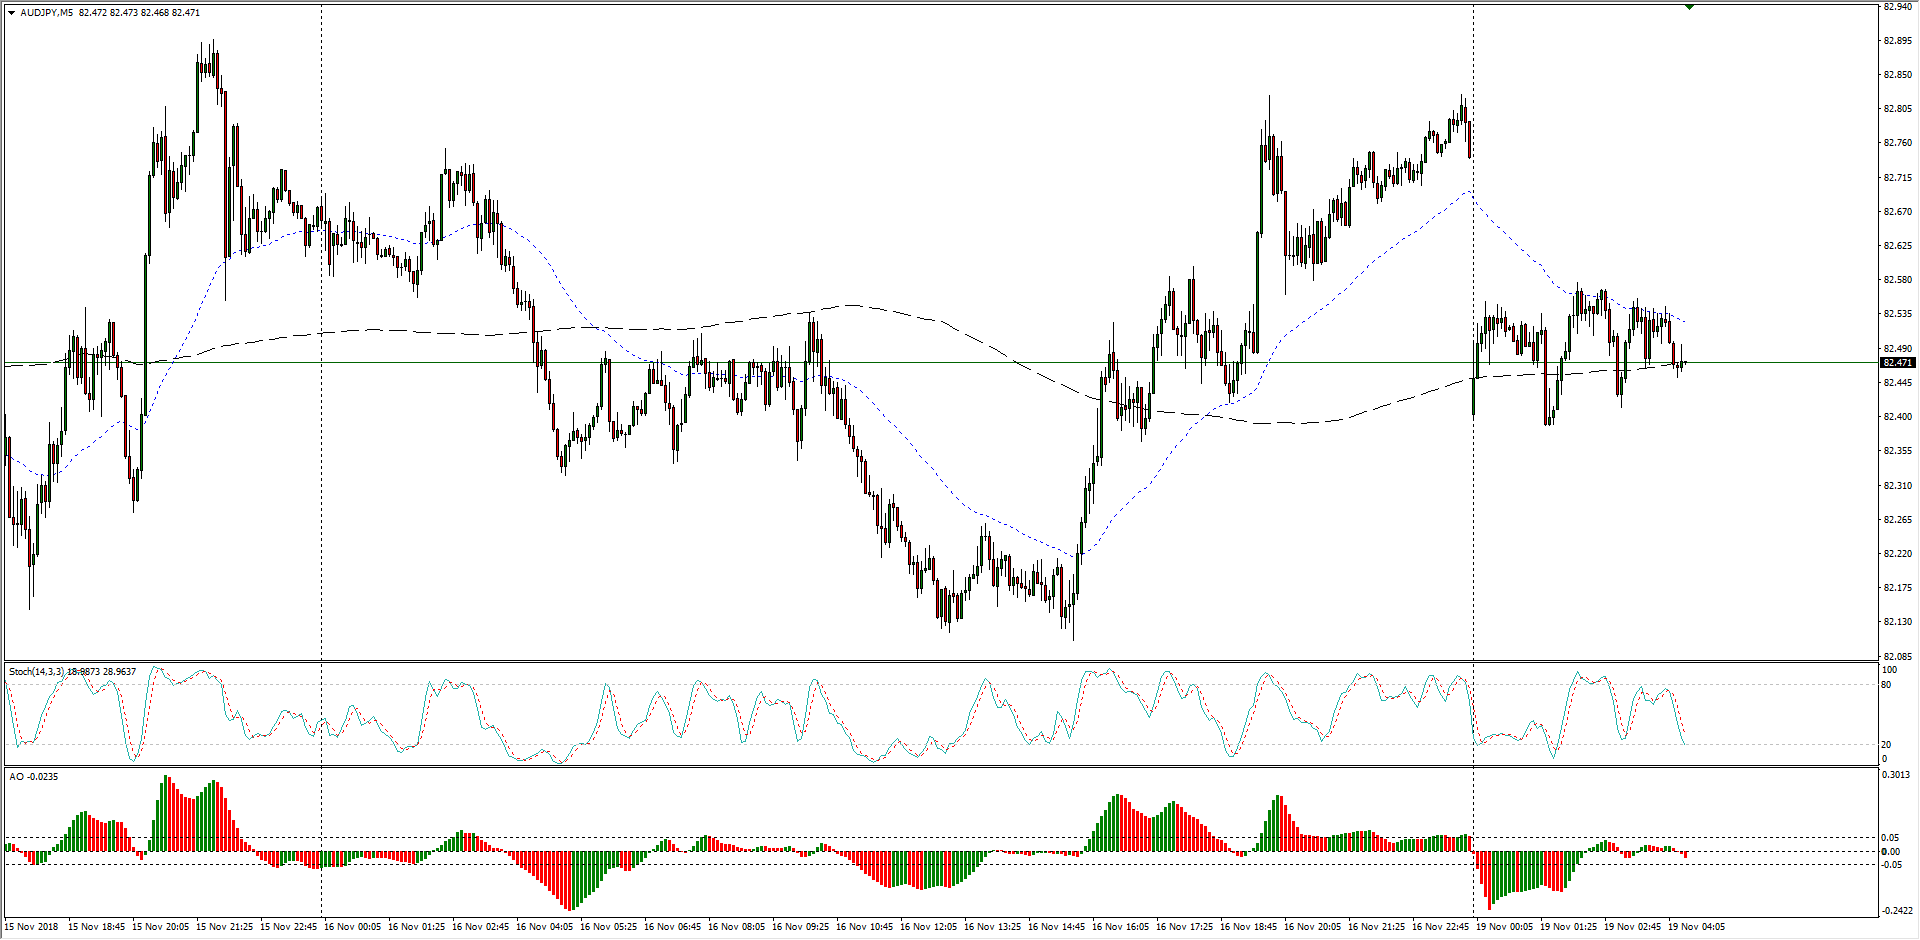
  • Over the past two weeks, the Aussie0Yen pairing has become familiar with the current range zone, especially in the latter half of last week, though the pair does remain buoyed from the near-term low of 81.40.

AUD/JPY Chart, 30-Minute

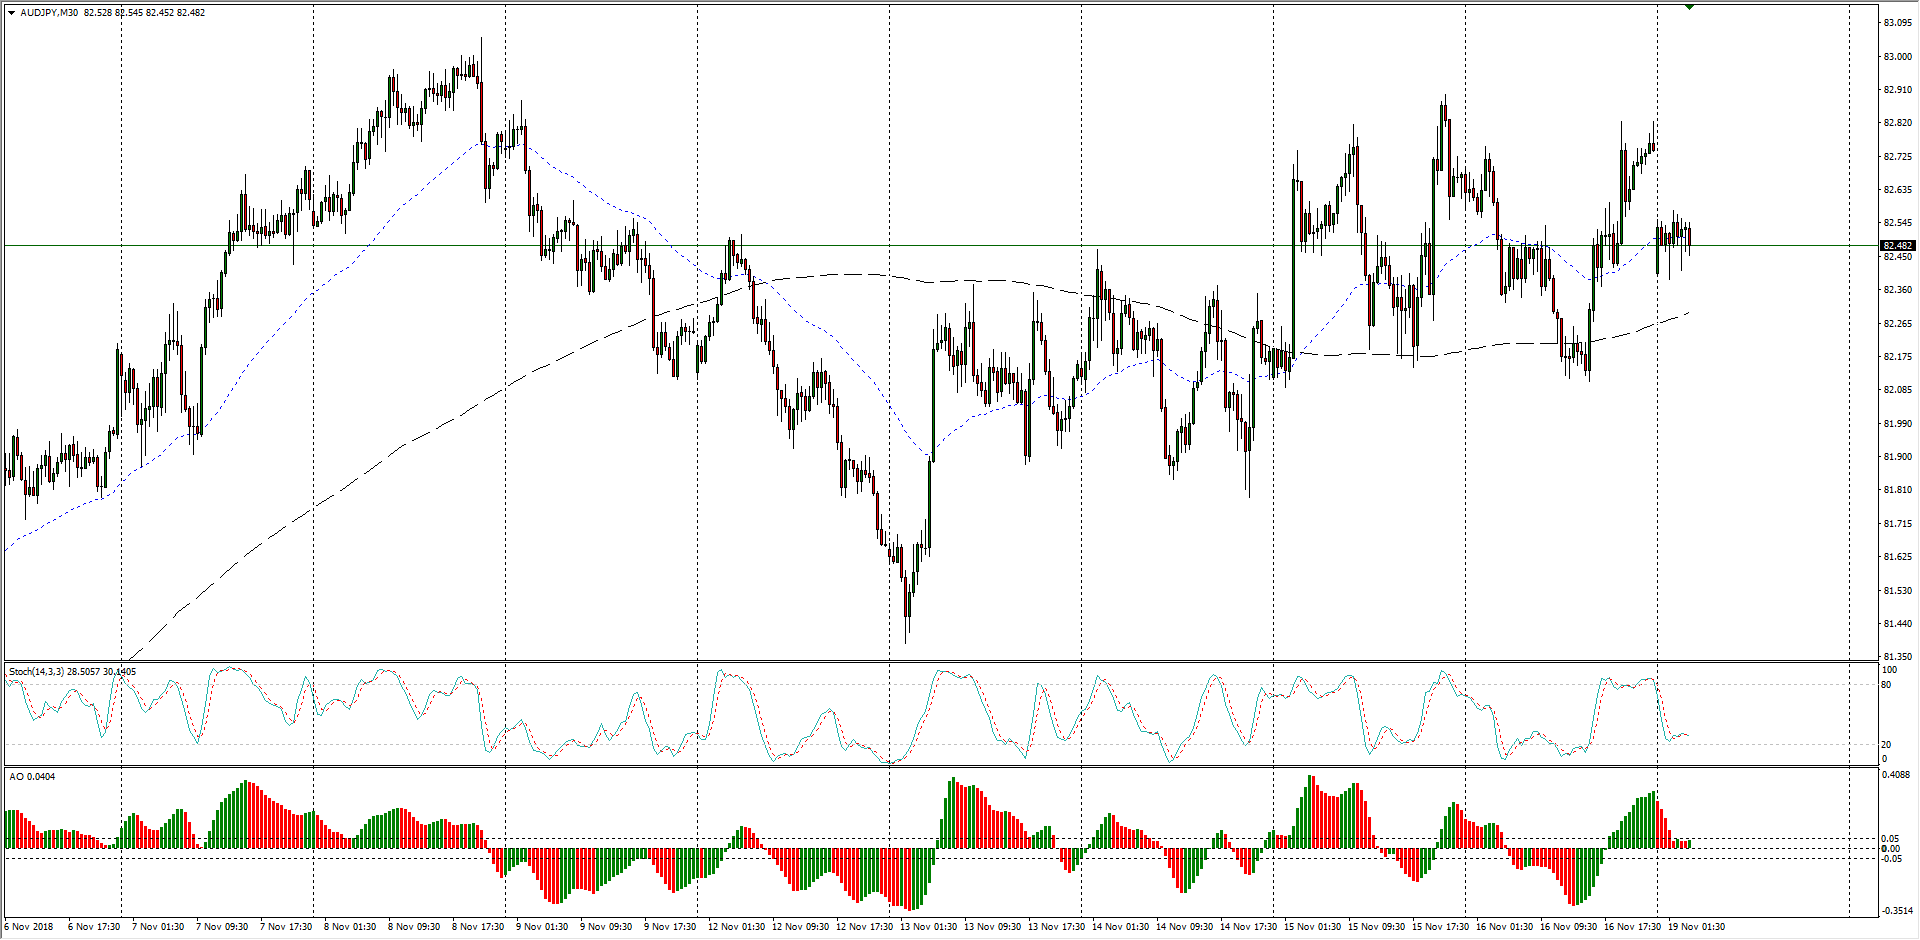
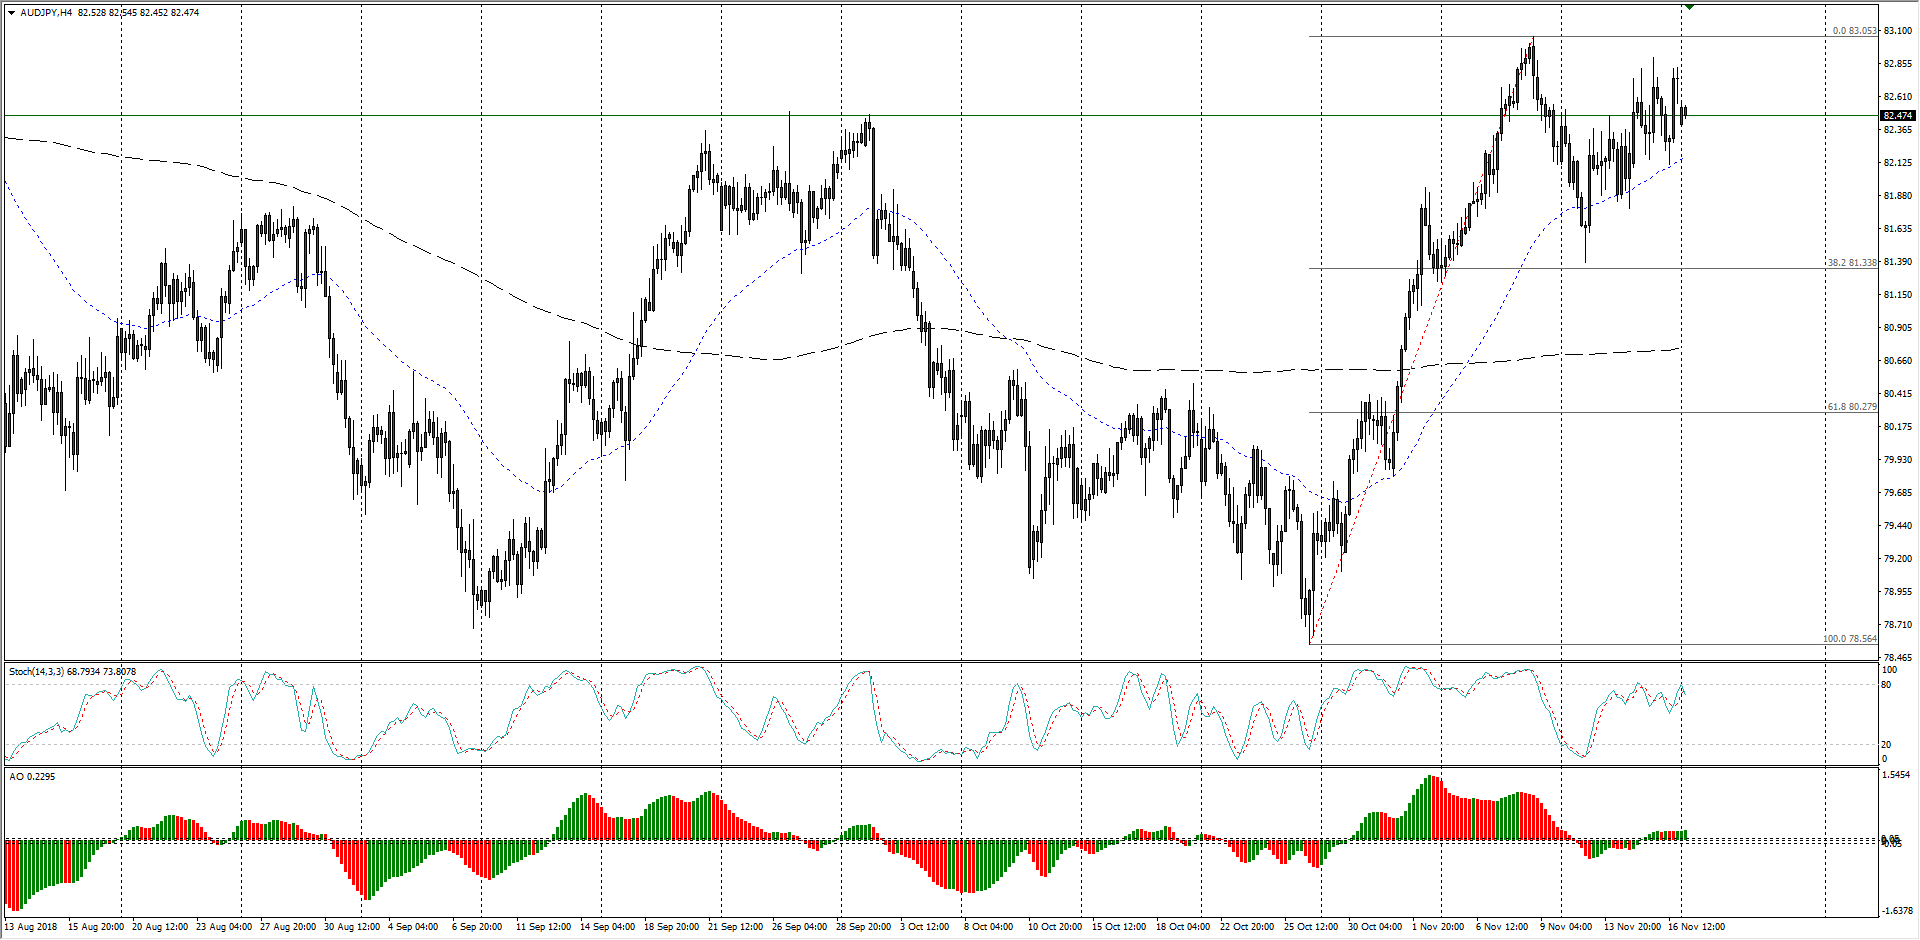
  • The past three months have the AUD/JPY trading inside of a rough long-term range, though support is being found for a potential upmove from the 38.2% Fibo retracement level from 81.35, while a bearish break down will take the AUD/JPY back into October's bottoms near 78.50.

AUD/JPY Chart, 4-Hour

AUD/JPY

Overview:
    Last Price: 82.47
    Daily change: -26 pips
    Daily change: -0.314%
    Daily Open: 82.73
Trends:
    Daily SMA20: 81.14
    Daily SMA50: 80.87
    Daily SMA100: 81.29
    Daily SMA200: 82.01
Levels:
    Daily High: 82.84
    Daily Low: 82.11
    Weekly High: 82.9
    Weekly Low: 81.39
    Monthly High: 82.5
    Monthly Low: 78.56
    Daily Fibonacci 38.2%: 82.56
    Daily Fibonacci 61.8%: 82.39
    Daily Pivot Point S1: 82.28
    Daily Pivot Point S2: 81.83
    Daily Pivot Point S3: 81.55
    Daily Pivot Point R1: 83.01
    Daily Pivot Point R2: 83.28
    Daily Pivot Point R3: 83.73

Author

Joshua Gibson

Joshua joins the FXStreet team as an Economics and Finance double major from Vancouver Island University with twelve years' experience as an independent trader focusing on technical analysis.

More from Joshua Gibson
Share:

Editor's Picks

EUR/USD holds firm above 1.1900 as US NFP looms

EUR/USD holds its upbeat momentum above 1.1900 in the European trading hours on Wednesday, helped by a broadly weaker US Dollar. Markets could turn cautious later in the day as the delayed US employment report for January will takes center stage. 

GBP/USD remains above nine-day EMA near 1.3650

GBP/USD recovers its recent losses from the previous session, trading around 1.3680 during the European hours on Wednesday. The technical analysis of the daily chart indicates a sustained bullish bias, as the pair trades within an ascending channel pattern.

Gold sticks to gains near $5,050 as focus shifts to US NFP

Gold holds moderate gains near the $5,050 level in the European session on Wednesday, reversing a part of the previous day's modest losses amid dovish US Federal Reserve-inspired US Dollar weakness. This, in turn, is seen as a key factor acting as a tailwind for the non-yielding yellow metal ahead of the critical US NFP release. 

US Nonfarm Payrolls expected to show modest job gains in January

The United States Bureau of Labor Statistics will release the delayed Nonfarm Payrolls data for January on Wednesday at 13:30 GMT. Investors expect NFP to rise by 70K following the 50K increase recorded in December.

S&P 500 at 7,000 is a valuation test, not a liquidity problem

The rebound from last week’s drawdown never quite shook the sense that it was being supported by borrowed conviction. The S&P 500 once again tested near the 7,000 level (6,986 as the high watermark) and failed, despite a macro backdrop that would normally be interpreted as supportive of risk.

Bitcoin price slips below $67,000 ahead of US Nonfarm Payrolls data

Bitcoin price extends losses, and trades below the lower consolidating boundary at $67,300 at the time of writing. A firm close below this level could trigger a deeper correction for BTC. Despite the weakness in price action, institutional demand shows signs of support, recording mild inflows in ETFs so far this week.