AUD/JPY Price Forecast: Steadies near 93.69 after two-day slide
- AUD/JPY drops 0.25% on Thursday, extending retreat below 94.00 for the second straight session.
- Bearish engulfing pattern weighed on price, but RSI holding above 50 suggests downside momentum is weakening.
- First resistance aligns at 94.00; a break may expose 95.00 and May’s peak at 95.63.
- Support seen at Senkou Span A (93.51), followed by Tenkan-sen (93.39) and the psychological 93.00 level.

AUD/JPY retreated for the second consecutive day, remained below the 94.00 figure, and printed losses of 0.25% on Thursday. At the time of writing, the cross-pair trades at 93.66, virtually unchanged.
AUD/JPY Price Forecast: Technical outlook
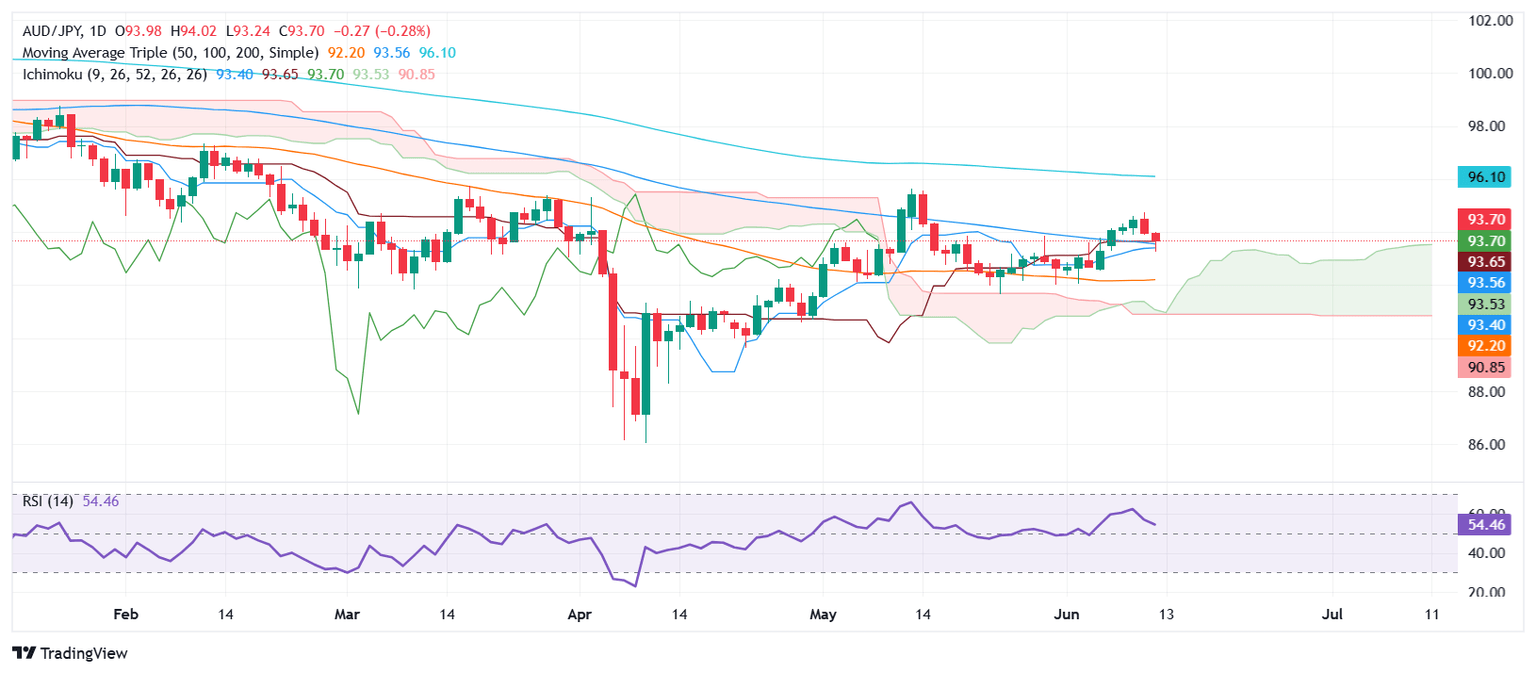
The AUD/JPY pair formed a ‘bearish engulfing’ candle chart pattern, which sent the pair drifting toward its weekly low of 93.22 on June 12 before recovering some ground. The Relative Strength Index (RSI) appears to have bottomed above its 50-neutral line, indicating that buyers are stepping in. Therefore, an improvement in risk appetite and Japanese Yen (JPY) weakness could send the cross higher.
The first resistance level would be the 94.00 figure. If surpassed, the next resistance would be 95.00, followed by the May 13 daily high at 95.63. The following key resistance levels are 96.00 and the February 12 high of 97.32.
On the flip side, if AUD/JPY tumbles below the Senkou Span A at 93.51, up next lies the Tenkan-sen at 93.39, ahead of the 93.00 figure.
AUD/JPY Price Chart – Daily
Australian Dollar PRICE This week
The table below shows the percentage change of Australian Dollar (AUD) against listed major currencies this week. Australian Dollar was the strongest against the US Dollar.
| USD | EUR | GBP | JPY | CAD | AUD | NZD | CHF | |
|---|---|---|---|---|---|---|---|---|
| USD | -1.66% | -0.65% | -0.98% | -0.68% | -0.53% | -0.79% | -1.39% | |
| EUR | 1.66% | 1.02% | 0.68% | 0.99% | 1.17% | 0.88% | 0.26% | |
| GBP | 0.65% | -1.02% | -0.23% | -0.02% | 0.16% | -0.14% | -0.75% | |
| JPY | 0.98% | -0.68% | 0.23% | 0.31% | 0.40% | 0.13% | -0.54% | |
| CAD | 0.68% | -0.99% | 0.02% | -0.31% | 0.13% | -0.11% | -0.72% | |
| AUD | 0.53% | -1.17% | -0.16% | -0.40% | -0.13% | -0.29% | -0.89% | |
| NZD | 0.79% | -0.88% | 0.14% | -0.13% | 0.11% | 0.29% | -0.61% | |
| CHF | 1.39% | -0.26% | 0.75% | 0.54% | 0.72% | 0.89% | 0.61% |
The heat map shows percentage changes of major currencies against each other. The base currency is picked from the left column, while the quote currency is picked from the top row. For example, if you pick the Australian Dollar from the left column and move along the horizontal line to the US Dollar, the percentage change displayed in the box will represent AUD (base)/USD (quote).
Author

Christian Borjon Valencia
FXStreet
Markets analyst, news editor, and trading instructor with over 14 years of experience across FX, commodities, US equity indices, and global macro markets.


