AUD/JPY Price Forecast: Slides over 1%, yet it remains bullish biased
- AUD/JPY tumbles as landslide victory by Sanae Takaichi boosts Yen demand.
- Policy normalization bets at the Bank of Japan underpin broader Yen strength.
- Technical bias constructive, but break below 108.00 may trigger deeper pullback toward key moving averages.

The Aussie Dollar depreciates against the Japanese Yen on Wednesday, down by more than 1%, courtesy of broad Yen’s strength, courtesy of the landslide victory of Prime Minister Takaichi over the weekend. At the time of writing the AUD/JPY trades at 109.23.
Several factors currently support the Japanese yen, including anticipated monetary policy normalization by the Bank of Japan, the potential for intervention in foreign exchange markets by Japanese authorities, and the recent rise of the Nikkei Index due to increasing speculation about additional economic stimulus measures.
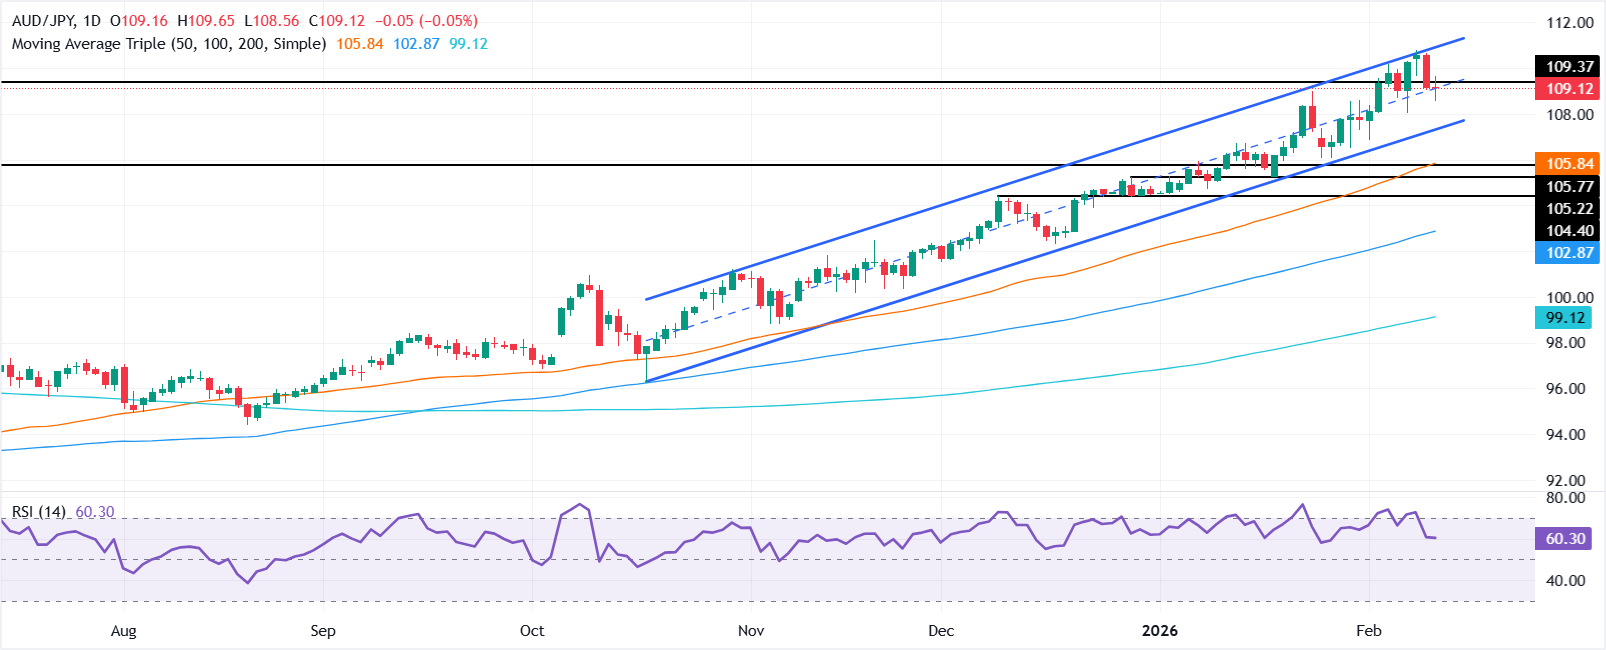
AUD/JPY Price Forecast: Technical outlook
Although the overall trend is up, the cross-pair is edging downwards, to the convergence of the 20-day SMA and a support trendline at around 107.99. Rising SMAs confirm the upward bias, but fundamental factors and a possible drop of the AUD/JPY below 108.00 could exacerbate a sell-off, pushing the pair towards the 50-day SMA at 105.75.
On further weakness, the next key support levels are the 100- and 200-day SMAs, each at 102.74, and 99.08, respectively.
Conversely, if AUD/JPY rises past 110.00, expect a test of the yearly peak at 110.79.
AUD/JPY Price Chart – Daily
Japanese Yen Price This week
The table below shows the percentage change of Japanese Yen (JPY) against listed major currencies this week. Japanese Yen was the strongest against the US Dollar.
| USD | EUR | GBP | JPY | CAD | AUD | NZD | CHF | |
|---|---|---|---|---|---|---|---|---|
| USD | -0.50% | -0.27% | -2.76% | -0.75% | -1.63% | -0.52% | -0.74% | |
| EUR | 0.50% | 0.23% | -2.33% | -0.25% | -1.14% | -0.04% | -0.24% | |
| GBP | 0.27% | -0.23% | -2.23% | -0.47% | -1.37% | -0.26% | -0.49% | |
| JPY | 2.76% | 2.33% | 2.23% | 2.11% | 1.18% | 2.36% | 2.03% | |
| CAD | 0.75% | 0.25% | 0.47% | -2.11% | -0.79% | 0.24% | -0.02% | |
| AUD | 1.63% | 1.14% | 1.37% | -1.18% | 0.79% | 1.13% | 0.94% | |
| NZD | 0.52% | 0.04% | 0.26% | -2.36% | -0.24% | -1.13% | -0.23% | |
| CHF | 0.74% | 0.24% | 0.49% | -2.03% | 0.02% | -0.94% | 0.23% |
The heat map shows percentage changes of major currencies against each other. The base currency is picked from the left column, while the quote currency is picked from the top row. For example, if you pick the Japanese Yen from the left column and move along the horizontal line to the US Dollar, the percentage change displayed in the box will represent JPY (base)/USD (quote).
Author

Christian Borjon Valencia
FXStreet
Markets analyst, news editor, and trading instructor with over 14 years of experience across FX, commodities, US equity indices, and global macro markets.


