AUD/JPY Price Forecast: Pares intraday losses to 99.00, the lowest since early October
- AUD/JPY finds some support near the 99.00 mark and rebounds from a near two-month low.
- The technical setup favors bearish traders and supports prospects for further depreciation.
- A sustained strength beyond the 101.00 mark might negate the near-term negative outlook.

The AUD/JPY cross drops to its lowest level since early October during the Asian session on Tuesday, albeit it finds decent support and rebounds around 75-80 pips from the vicinity of the 99.00 round figure. Spot prices, however, remain below the 100.00 psychological mark and seem vulnerable amid US-China trade war concerns.
US President-elect Donald Trump threatened to impose a 25% tariff on all products coming into the US from Mexico and Canada and an additional 10% tariff on all Chinese imports. Adding to this, persistent geopolitical risks stemming from the Russia-Ukraine war and the ongoing conflicts in the Middle East temper investors' appetite for riskier assets. This, in turn, drives some haven flows towards the Japanese Yen (JPY) and weighs on the perceived riskier Aussie, exerting some downward pressure on the AUD/JPY cross.
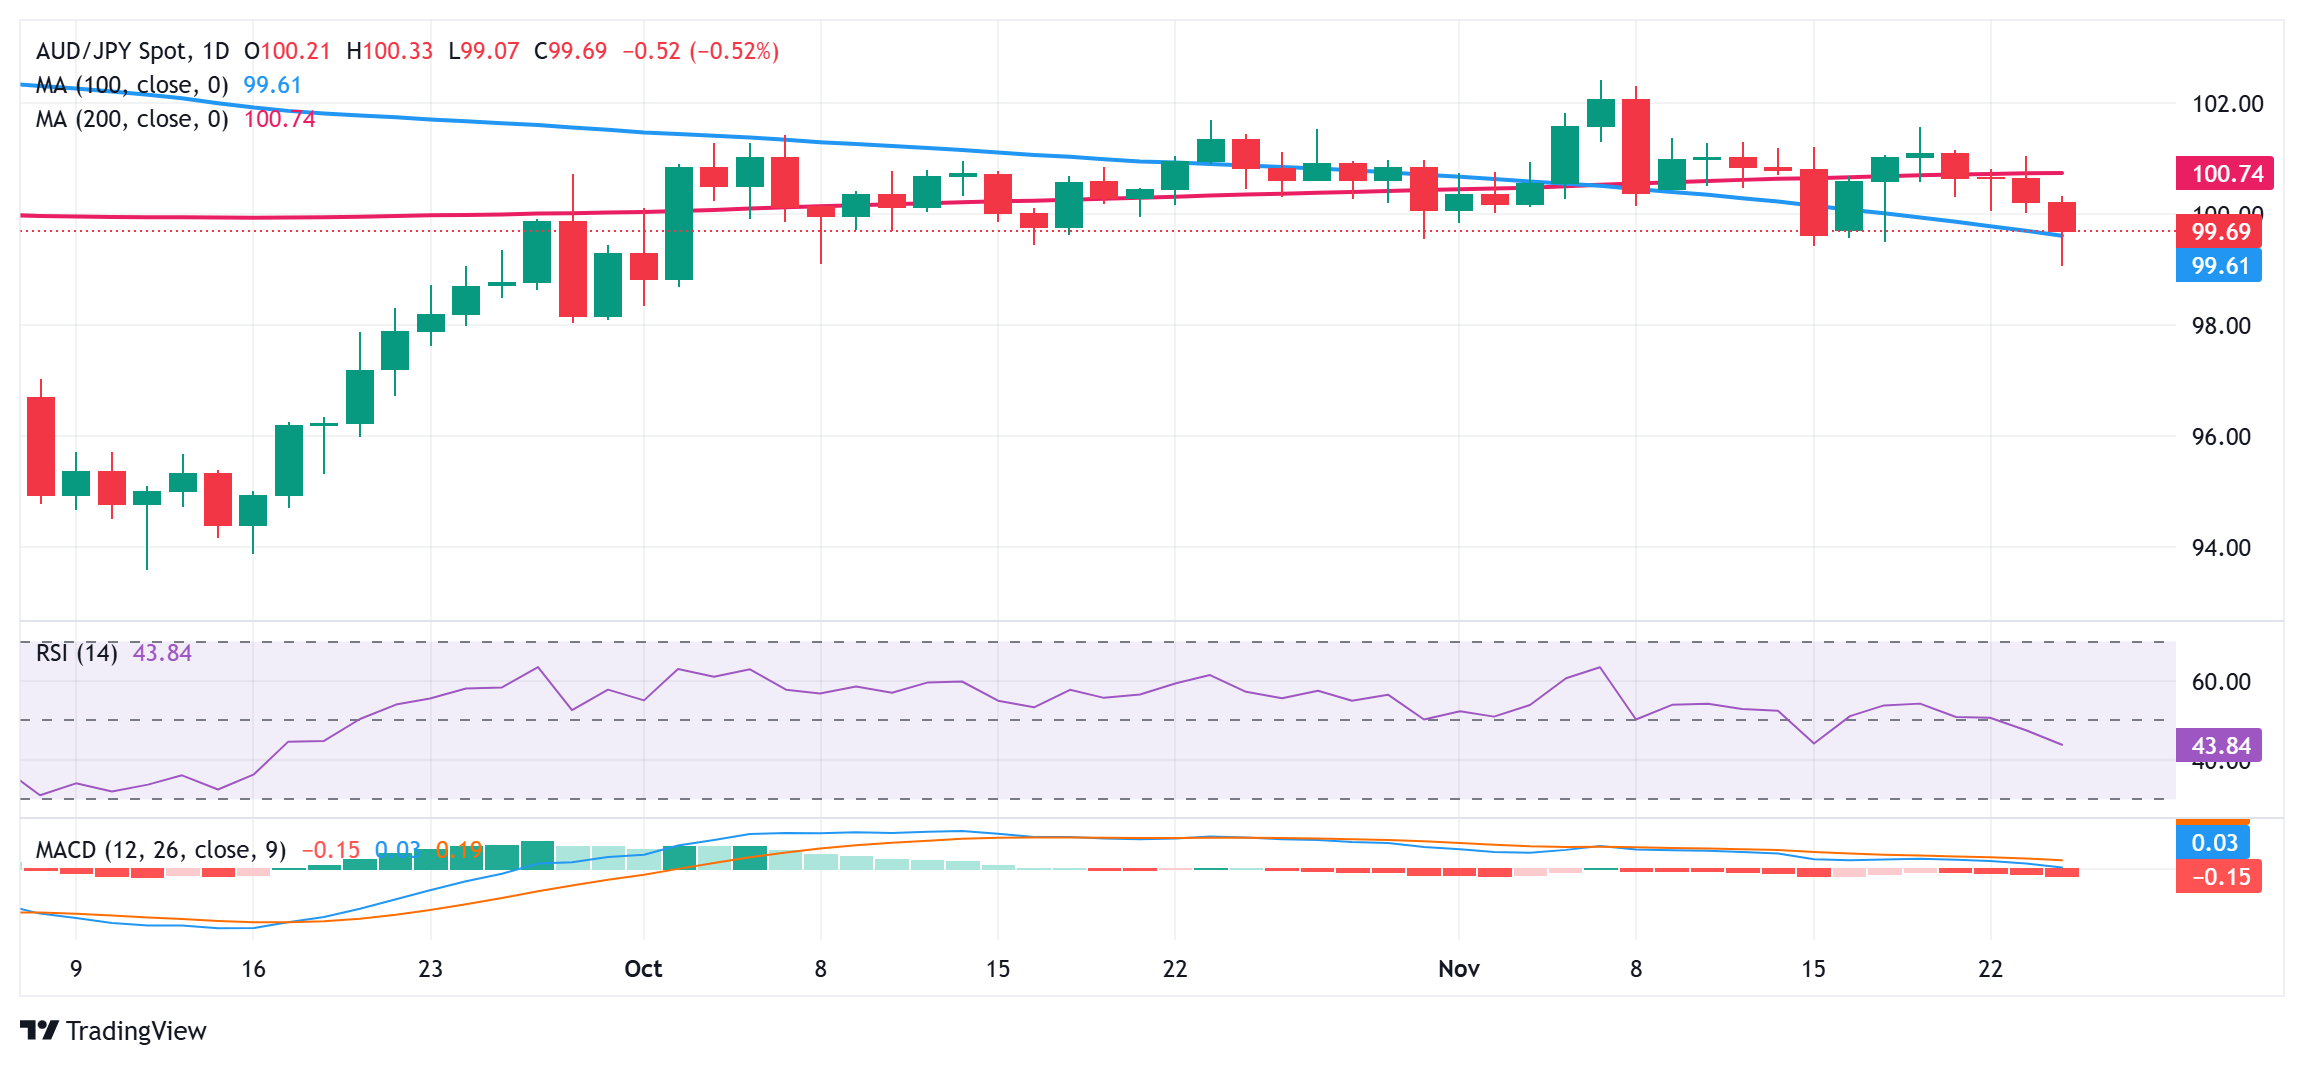
From a technical perspective, oscillators on the daily chart have just started gaining negative traction and support prospects for a further depreciating move. That said, resilience below the 100-day Simple Moving Average (SMA) and the subsequent bounce warrant some caution for bearish traders. This makes it prudent to wait for a sustained break and acceptance below the 99.00 mark before positioning for deeper losses. The AUD/JPY cross might then slide below the 98.70-98.65 intermediate support and test the 98.00 mark.
On the flip side, any move up beyond the 100.00 mark is likely to confront some resistance near the Asian session high, around the 100.25-100.30 region, ahead of the 100.55-100.60 horizontal barrier. This is followed by the overnight swing high, around the 101.00 round figure, which if cleared could lift the AUD/JPY cross to the 101.55 intermediate resistance en route to the 102.00 mark. The momentum could eventually lift spot prices back towards the 102.30-102.40 region, or the highest level since July 24 touched earlier this month.
AUD/JPY daily chart
Japanese Yen PRICE Today
The table below shows the percentage change of Japanese Yen (JPY) against listed major currencies today. Japanese Yen was the strongest against the Canadian Dollar.
| USD | EUR | GBP | JPY | CAD | AUD | NZD | CHF | |
|---|---|---|---|---|---|---|---|---|
| USD | 0.13% | 0.12% | -0.37% | 0.92% | 0.14% | 0.03% | 0.07% | |
| EUR | -0.13% | -0.00% | -0.50% | 0.79% | 0.02% | -0.09% | -0.06% | |
| GBP | -0.12% | 0.00% | -0.48% | 0.78% | 0.02% | -0.09% | -0.06% | |
| JPY | 0.37% | 0.50% | 0.48% | 1.29% | 0.52% | 0.39% | 0.44% | |
| CAD | -0.92% | -0.79% | -0.78% | -1.29% | -0.76% | -0.88% | -0.85% | |
| AUD | -0.14% | -0.02% | -0.02% | -0.52% | 0.76% | -0.12% | -0.08% | |
| NZD | -0.03% | 0.09% | 0.09% | -0.39% | 0.88% | 0.12% | 0.04% | |
| CHF | -0.07% | 0.06% | 0.06% | -0.44% | 0.85% | 0.08% | -0.04% |
The heat map shows percentage changes of major currencies against each other. The base currency is picked from the left column, while the quote currency is picked from the top row. For example, if you pick the Japanese Yen from the left column and move along the horizontal line to the US Dollar, the percentage change displayed in the box will represent JPY (base)/USD (quote).
Author

Haresh Menghani
FXStreet
Haresh Menghani is a detail-oriented professional with 10+ years of extensive experience in analysing the global financial markets.


