AUD/JPY Price Analysis: Stays firm with small gains, upbeat sentiment could fuel ascent


  • AUD/JPY kicks off the week just under the 92.00 mark, leveraging positive market sentiment that favors riskier assets over safe havens like the Japanese Yen.
  • The AUD/JPY technical outlook remains bullish, with indicators like the RSI and the 3-day RoC hinting at gathering momentum among buyers.
  • AUD/JPY faces immediate resistance at 92.00, with the potential to challenge the YTD high of 92.99; downside support stands at the May 29 low of 91.59, with further falls potentially targeting 91.00.

AUD/JPY begins the week on the right foot, though almost unchanged as Tuesday’s Asian session begins, registering minuscule gains of 0.05%, below the 92.00 figure. An upbeat market sentiment could bolster appetite for riskier assets, leaving safe-haven assets or peers like the Japanese Yen (JPY) vulnerable to further losses.

AUD/JPY Price Analysis: Technical outlook

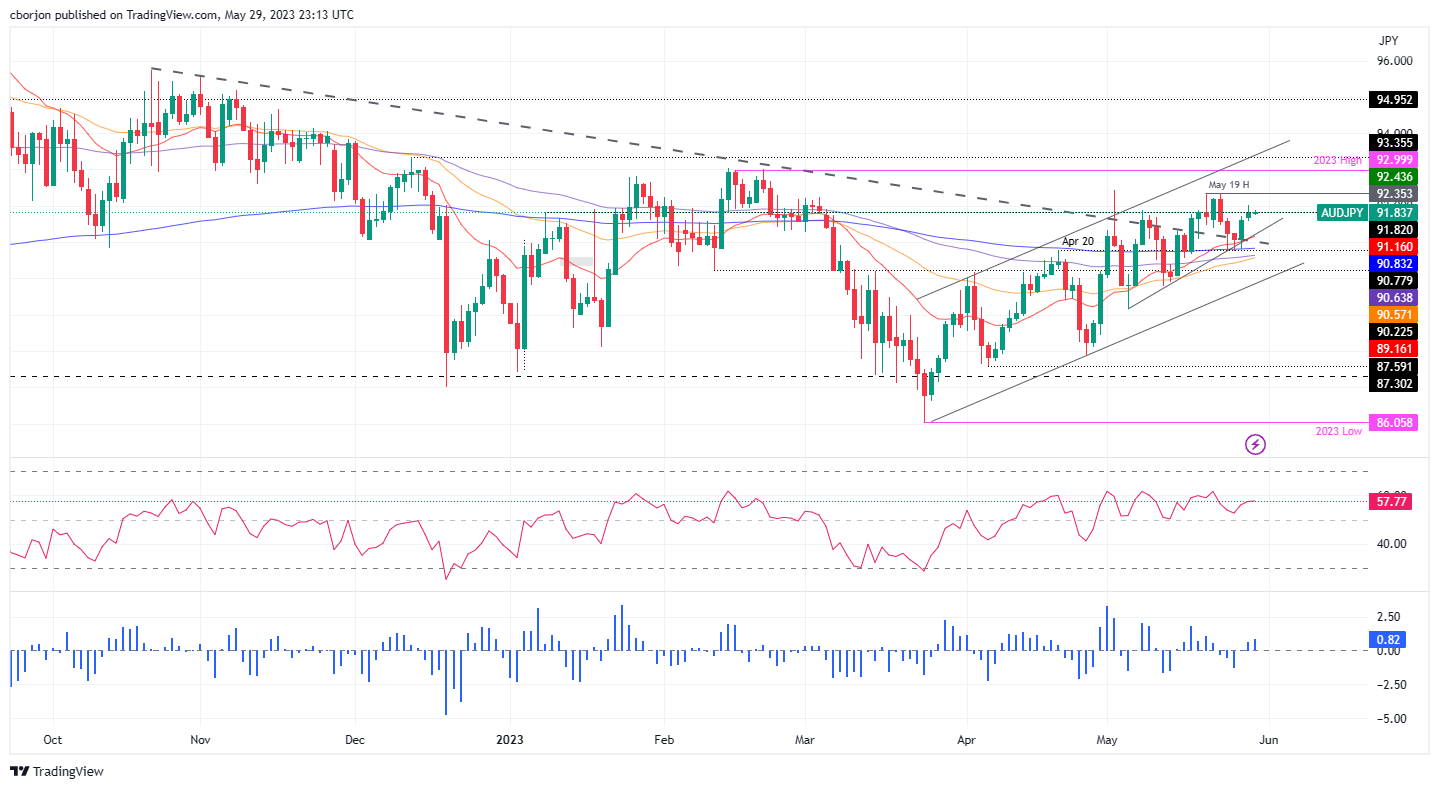
From a technical perspective, the AUD/JPY is upward biased. Given the fundamental backdrop with an improvement in risk appetite, further upside is expected. But on its way north, the AUD/JPY must hurdle some crucial resistance levels. Additionally, the Relative Strength Index (RSI) indicator is in bullish territory, while the 3-day Rate of Change (RoC) jumped above its prior day peak, suggesting that buyers are gathering momentum.

The AUD/JPY first resistance would be the 92.00 mark. Break above will expose the last week’s high of 92.35, followed by the 92.50 mid-point before challenging the year-to-date (YTD) high of 92.99. On the other hand, the AUD/JPY first support would be the 91.59 May 29 low. Once cleared, the AUD/JPy could dive toward one-month-old upslope support at around 91.30/91.20 before dropping toward 91.00.

AUD/JPY Price Action – Daily chart

AUD/JPY Daily chart

AUD/JPY

Overview
Today last price 91.89
Today Daily Change 0.26
Today Daily Change % 0.28
Today daily open 91.63
 
Trends
Daily SMA20 91.12
Daily SMA50 89.79
Daily SMA100 90.41
Daily SMA200 91.92
 
Levels
Previous Daily High 91.72
Previous Daily Low 90.8
Previous Weekly High 92.35
Previous Weekly Low 90.76
Previous Monthly High 90.78
Previous Monthly Low 87.59
Daily Fibonacci 38.2% 91.37
Daily Fibonacci 61.8% 91.15
Daily Pivot Point S1 91.04
Daily Pivot Point S2 90.46
Daily Pivot Point S3 90.12
Daily Pivot Point R1 91.97
Daily Pivot Point R2 92.3
Daily Pivot Point R3 92.89


Share: Feed news

Information on these pages contains forward-looking statements that involve risks and uncertainties. Markets and instruments profiled on this page are for informational purposes only and should not in any way come across as a recommendation to buy or sell in these assets. You should do your own thorough research before making any investment decisions. FXStreet does not in any way guarantee that this information is free from mistakes, errors, or material misstatements. It also does not guarantee that this information is of a timely nature. Investing in Open Markets involves a great deal of risk, including the loss of all or a portion of your investment, as well as emotional distress. All risks, losses and costs associated with investing, including total loss of principal, are your responsibility. The views and opinions expressed in this article are those of the authors and do not necessarily reflect the official policy or position of FXStreet nor its advertisers. The author will not be held responsible for information that is found at the end of links posted on this page.

If not otherwise explicitly mentioned in the body of the article, at the time of writing, the author has no position in any stock mentioned in this article and no business relationship with any company mentioned. The author has not received compensation for writing this article, other than from FXStreet.

FXStreet and the author do not provide personalized recommendations. The author makes no representations as to the accuracy, completeness, or suitability of this information. FXStreet and the author will not be liable for any errors, omissions or any losses, injuries or damages arising from this information and its display or use. Errors and omissions excepted.

The author and FXStreet are not registered investment advisors and nothing in this article is intended to be investment advice.

Recommended content


Recommended content

Editors’ Picks

AUD/USD could extend the recovery to 0.6500 and above

AUD/USD could extend the recovery to 0.6500 and above

The enhanced risk appetite and the weakening of the Greenback enabled AUD/USD to build on the promising start to the week and trade closer to the key barrier at 0.6500 the figure ahead of key inflation figures in Australia.

AUD/USD News

EUR/USD now refocuses on the 200-day SMA

EUR/USD now refocuses on the 200-day SMA

EUR/USD extended its positive momentum and rose above the 1.0700 yardstick, driven by the intense PMI-led retracement in the US Dollar as well as a prevailing risk-friendly environment in the FX universe.

EUR/USD News

Gold struggles around $2,325 despite broad US Dollar’s weakness

Gold struggles around $2,325 despite broad US Dollar’s weakness

Gold reversed its direction and rose to the $2,320 area, erasing a large portion of its daily losses in the process. The benchmark 10-year US Treasury bond yield stays in the red below 4.6% following the weak US PMI data and supports XAU/USD.

Gold News

Bitcoin price makes run for previous cycle highs as Morgan Stanley pushes BTC ETF exposure

Bitcoin price makes run for previous cycle highs as Morgan Stanley pushes BTC ETF exposure

Bitcoin (BTC) price strength continues to grow, three days after the fourth halving. Optimism continues to abound in the market as Bitcoiners envision a reclamation of previous cycle highs.

Read more

US versus the Eurozone: Inflation divergence causes monetary desynchronization

US versus the Eurozone: Inflation divergence causes monetary desynchronization

Historically there is a very close correlation between changes in US Treasury yields and German Bund yields. This is relevant at the current juncture, considering that the recent hawkish twist in the tone of the Federal Reserve might continue to push US long-term interest rates higher and put upward pressure on bond yields in the Eurozone. 

Read more

Forex MAJORS

Cryptocurrencies

Signatures