|

AUD/JPY Price Analysis: Severe losses seen with indicators deep in negative territory

  • AUD/JPY drops towards 105.00, notably below the 20-day SMA.
  • The downtrend continues, now showing sharp momentum as bearish sentiment increases.
  • With intensified bearish momentum, the pair may see a slight upward correction.

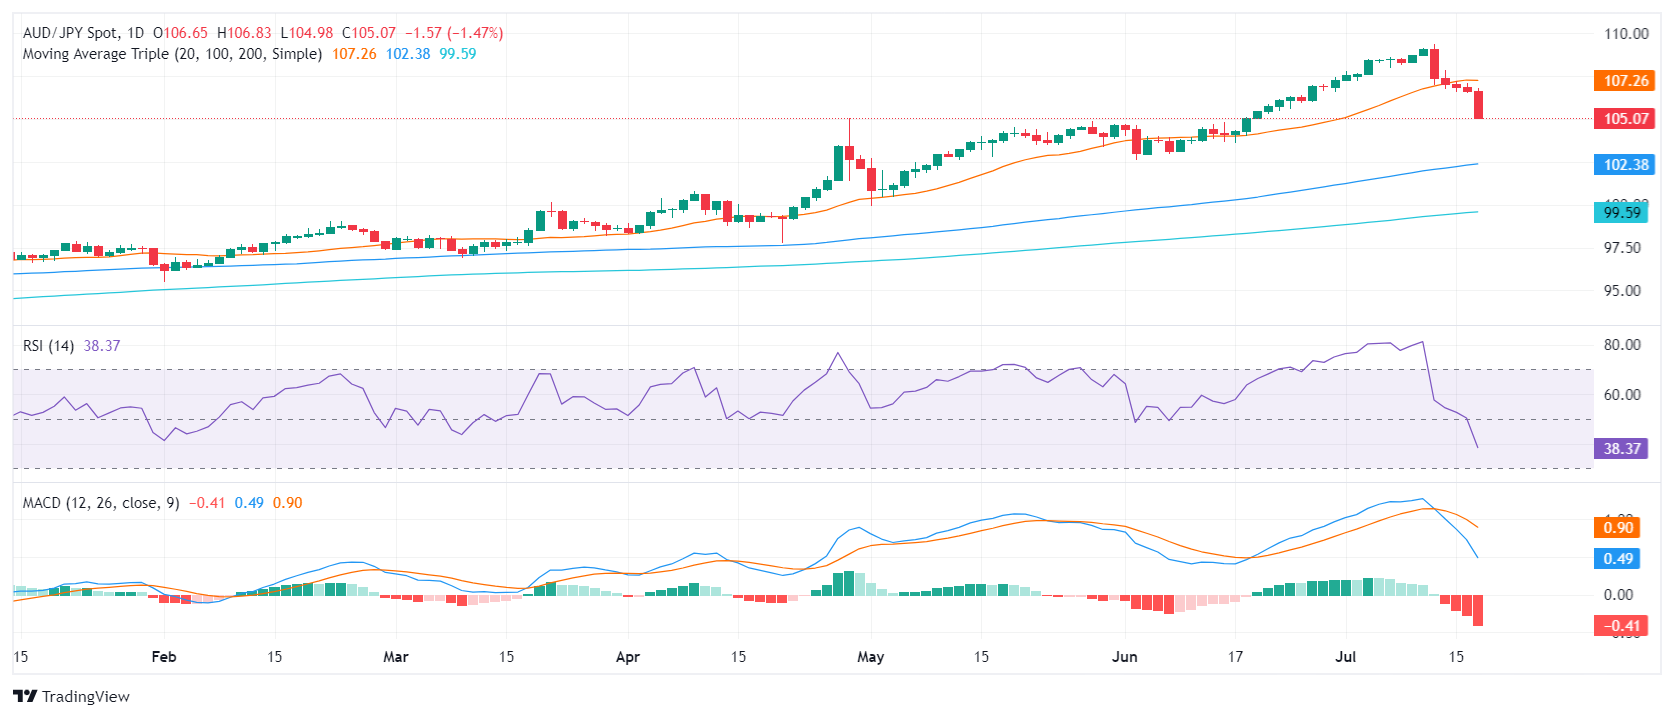
In Wednesday's session, the AUD/JPY pair recorded a significant drop to 105.05, marking an extended five-day losing streak from last week. This decline is a significant drop from Tuesday's close of 106.80, indicating a deepening bearish momentum for the pair. This continued downtrend, which is marked by indicators being deep in negative terrain, suggests that the pair may see further losses in the short term but a correction is also in the table.

The daily Relative Strength Index (RSI) for AUD/JPY now stands at 40, as the pair has reached new lows since mid-June. Simultaneously, the daily Moving Average Convergence Divergence (MACD) prints rising red bars, implying an intensified selling activity.

AUD/JPY daily chart

In the broader picture, the AUD/JPY pair seems to maintain its bearish tendency, much highlighted by its position notably below the 20-day Simple Moving Average (SMA) supports. As the pair proceeds its descent, immediate support levels at 105.00 and 104.30 become the crucial markers to watch. To avoid further potential losses, buyers must look to reclaim the 106.00 mark and further target the resurrection of the 106.50 level.

Author

Patricio Martín

Patricio is an economist from Argentina passionate about global finance and understanding the daily movements of the markets.

More from Patricio Martín
Share:

Markets move fast. We move first.

Orange Juice Newsletter brings you expert driven insights - not headlines. Every day on your inbox.

By subscribing you agree to our Terms and conditions.

Editor's Picks

EUR/USD clings to small gains near 1.1750

Following a short-lasting correction in the early European session, EUR/USD regains its traction and clings to moderate gains at around 1.1750 on Monday. Nevertheless, the pair's volatility remains low, with investors awaiting this weeks key data releases from the US and the ECB policy announcements.

GBP/USD edges higher toward 1.3400 ahead of US data and BoE

GBP/USD reverses its direction and advances toward 1.3400 following a drop to the 1.3350 area earlier in the day. The US Dollar struggles to gather recovery momentum as markets await Tuesday's Nonfarm Payrolls data, while the Pound Sterling holds steady ahead of the BoE policy announcements later in the week.

Gold pulls away from session high, holds above $4,300

Gold loses its bullish momentum and retreats below $4,350 after testing this level earlier on Monday. XAU/USD, however, stays in positive territory as the US Dollar remains on the back foot on growing expectations for a dovish Fed policy outlook next year.

Solana consolidates as spot ETF inflows near $1 billion signal institutional dip-buying

Solana price hovers above $131 at the time of writing on Monday, nearing the upper boundary of a falling wedge pattern, awaiting a decisive breakout. On the institutional side, demand for spot Solana Exchange-Traded Funds remained firm, pushing total assets under management to nearly $1 billion since launch. 

Big week ends with big doubts

The S&P 500 continued to push higher yesterday as the US 2-year yield wavered around the 3.50% mark following a Federal Reserve (Fed) rate cut earlier this week that was ultimately perceived as not that hawkish after all. The cut is especially boosting the non-tech pockets of the market.

Solana Price Forecast: SOL consolidates as spot ETF inflows near $1 billion signal institutional dip-buying

Solana (SOL) price hovers above $131 at the time of writing on Monday, nearing the upper boundary of a falling wedge pattern, awaiting a decisive breakout.