AUD/JPY Price Analysis: Sellers target the 200-day EMA as a bearish flag emerges
- The AUD/JPY is set to finish the week positive, up by 0.43%.
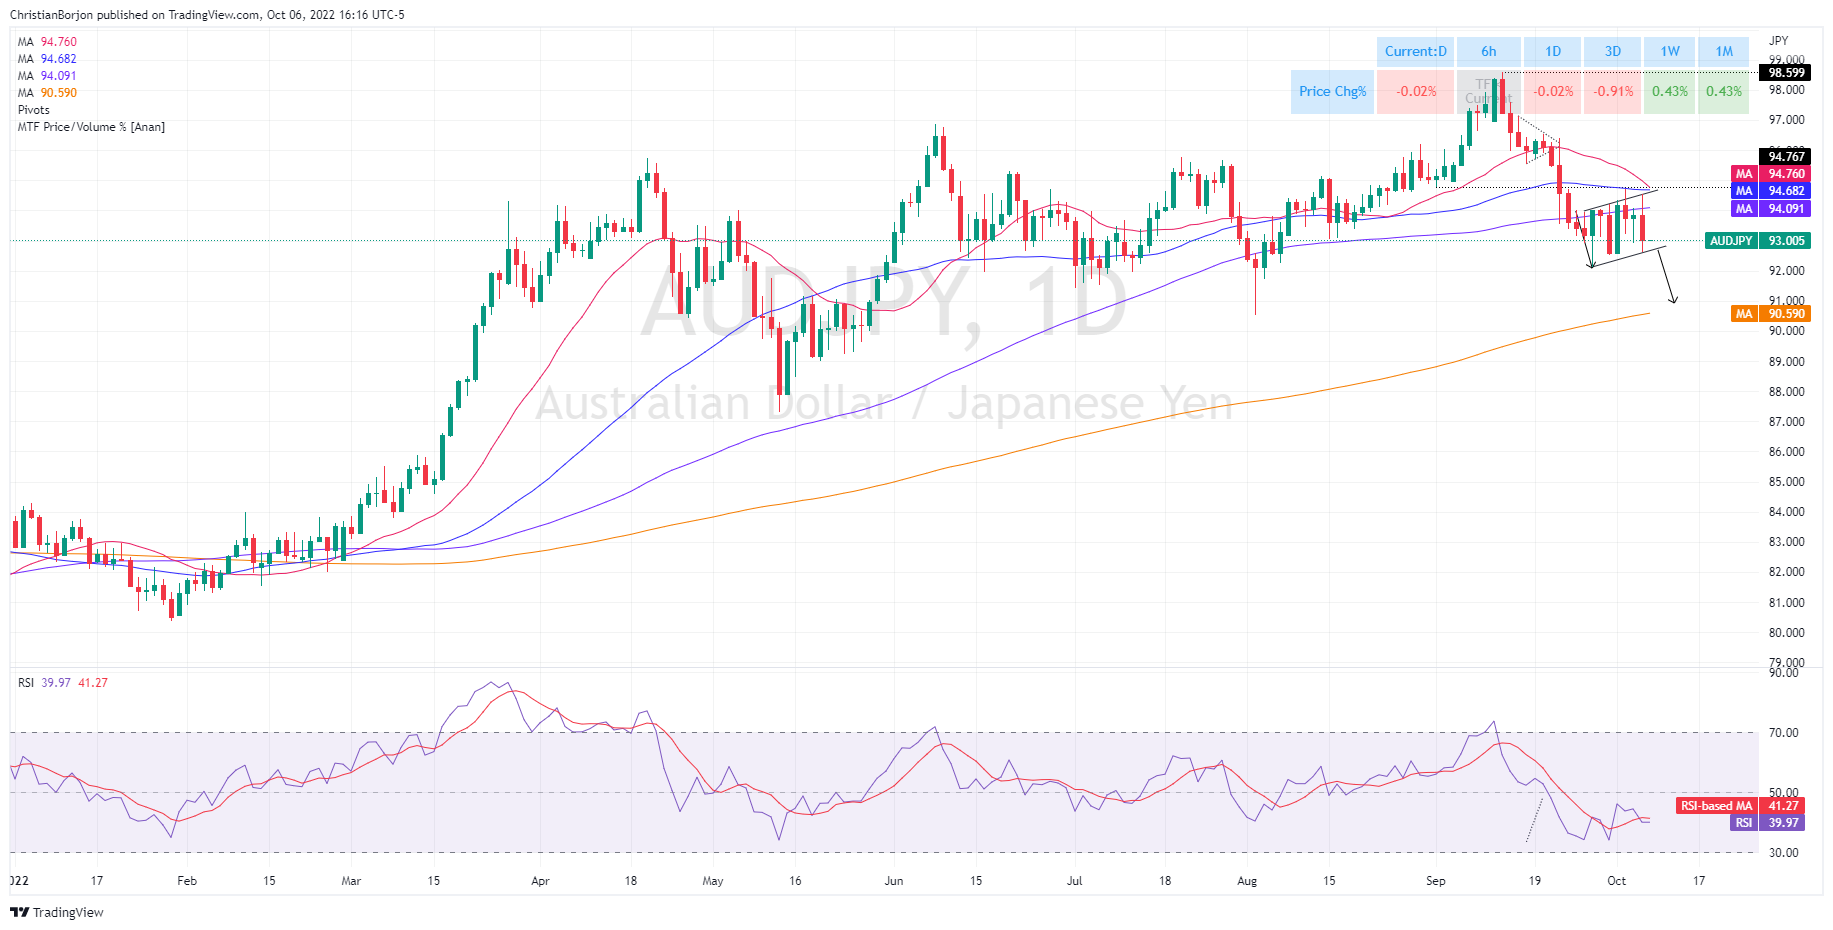
- A bearish flag emerged in the daily chart perspective, which targets a fall toward the 200-day EMA at 90.58

As the Asian Pacific session begins, the AUD/JPY is almost flat during the day, following Thursday’s 0.87% fall, due to risk-off impulse, as shown by US equities falling between 0.68% and 1.15%. Factors like mixed US economic data reported during the week, and market speculations of a Fed dovish pivot waning, bolstered safe-haven assets, like the US dollar and the Japanese yen. At the time of writing, the AUD/JPY is trading at 93.00, almost flat.
AUD/JPY Price Forecast
The AUD/JPY daily chart shows the pair consolidates around the 93.00-94.60 range, forming a bearish flag. Notably, the AUD/JPY has faced solid resistance around 94.00/60, around the top-trend line of the bearish flag.
Since Wednesday, the AUD/JPY traded, near the bottom of the bearish flag, though on Thursday, rallied towards the top and retraced those earlier gains. Therefore, the AUD/JPY path of least resistance is downward biased, further confirmed by the Relative Strength Index (RSI), staying in bearish territory, below its 7-day RSI’s SMA.
Therefore, the AUD/JPY first support would be the bearish flag bottom trendline around 92.50-75. A breach of the latter will expose the September 28 cycle low at 92.12, immediately followed by the 92.00 figure. Once cleared, the AUD/JPY might slide towards the 200-day EMA at 90.58.
AUD/JPY Additional Technical Levels
Author

Christian Borjon Valencia
FXStreet
Markets analyst, news editor, and trading instructor with over 14 years of experience across FX, commodities, US equity indices, and global macro markets.


