AUD/JPY Price Analysis: Retreats from Tuesday’s daily highs around 86.00, steady at 85.60
- AUD/JPY extends its two-day rally but faces strong resistance at 86.00.
- AUD/JPY price action is driven by market sentiment and Australian macroeconomic figures.
- AUD/JPY: The daily and hourly charts are tilted to the upside, but both time-frames RSI’s figures are closing to overbought levels.

The AUD/JPY slides as the New York session ends, barely down 0.01%, trading at 85.61 at the time of writing. On Tuesday, the Australian dollar extended its rally against the Japanese yen, for the second consecutive day, up in the week 1.53%.
Risk-on market sentiment keeps investors propelling the US stock market, as portrayed by the S&P 500 reaching an all-time high during the New York session, contrarily US T-bond yields fell across the board, with the 10-benchmark note falling two and a half basis points, sits at 1.61%.
That said, the AUD/JPY pair will lie for the remainder of the week on market sentiment, and in macroeconomic figures, like Australia CPI figures.
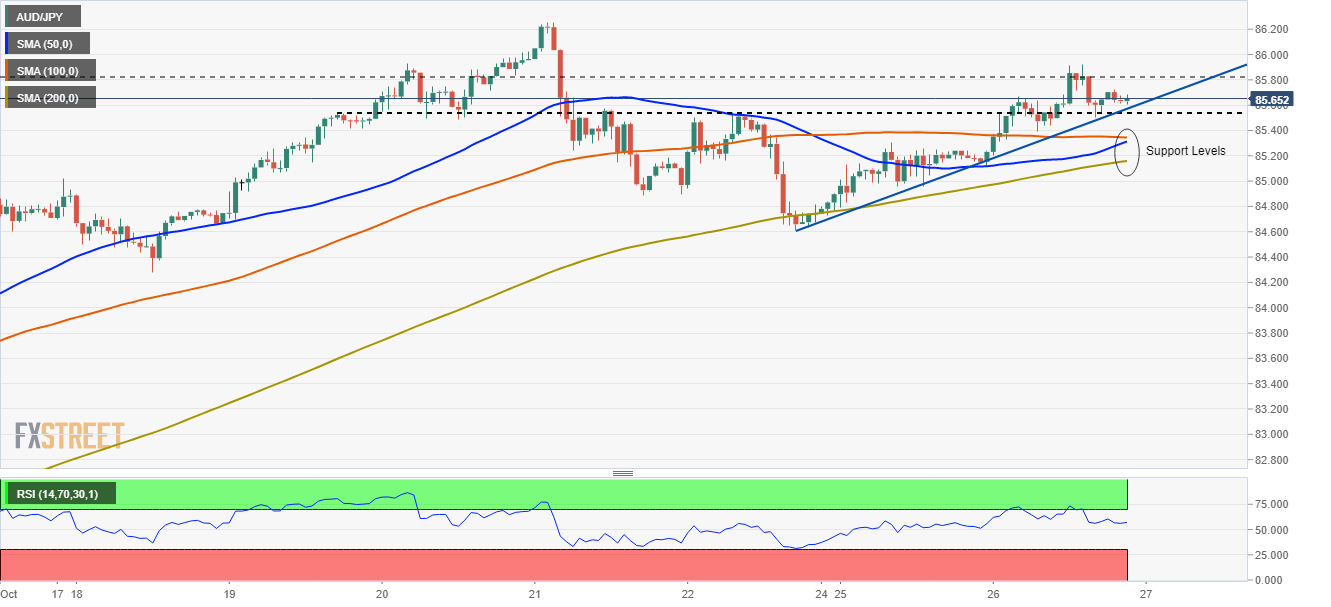
AUD/JPY Price Forecast: Technical outlook
Daily chart
The daily chart portrays the cross-currency has an upward bias, depicted by the daily moving averages (DMA’s) remaining below the spot price with an up slope confirming the actual trend.
The pair is testing the 61.8% Fibonacci retracement at press time, which coincided with the May 10 high around the 85.60-75 area. An upside break of the latter would expose the October 26 high at 85.92, immediately followed by the October 21 at 86.25.
On the flip side, failure at the 61.8% Fibonacci retracement could lead to an AUD/JPY slide towards 84.60, as the RSI exits overbought levels.
The Relative Strenght Index (RSI) at 72 flattish in overbought levels indicates the AUD/JPY might consolidate before determining which direction to take. However, the potential of an upside bias is supported by the DMA’s.

1-hour chart
The hourly chart shows that the AUD/JPY pair is in consolidation, just retreated from daily highs threatening to form a head-and-shoulders pattern. The hourly simple moving averages (HSMA) lie below the spot price, with the 50-HMA trapped within the 100 and the 200-HMA’s, confirming a sideways trend. A break below an upslope trendline around the 85.40 area confirms the pair’s head-and-shoulders pattern and exerts additional downward pressure on the AUD/JPY.
The first supply zone on the downside would be the 100-HSMA at 85.34, immediately followed by the 50-HSMA at 85.31, and then the 200-HSMA at 85.16.
The Relative Strength Index (RSI) is at 57 is edging slightly low, but as it remains above the 50-midline, it will refrain sellers from opening fresh downward bets on the AUD/JPY pair.
Author

Christian Borjon Valencia
FXStreet
Markets analyst, news editor, and trading instructor with over 14 years of experience across FX, commodities, US equity indices, and global macro markets.


