|

AUD/JPY Price Analysis: Recovers from weekly losses, still bearish below 96.00

  • Despite printing daily gains, the AUD/JPY is set to finish the week down by more than 2%.
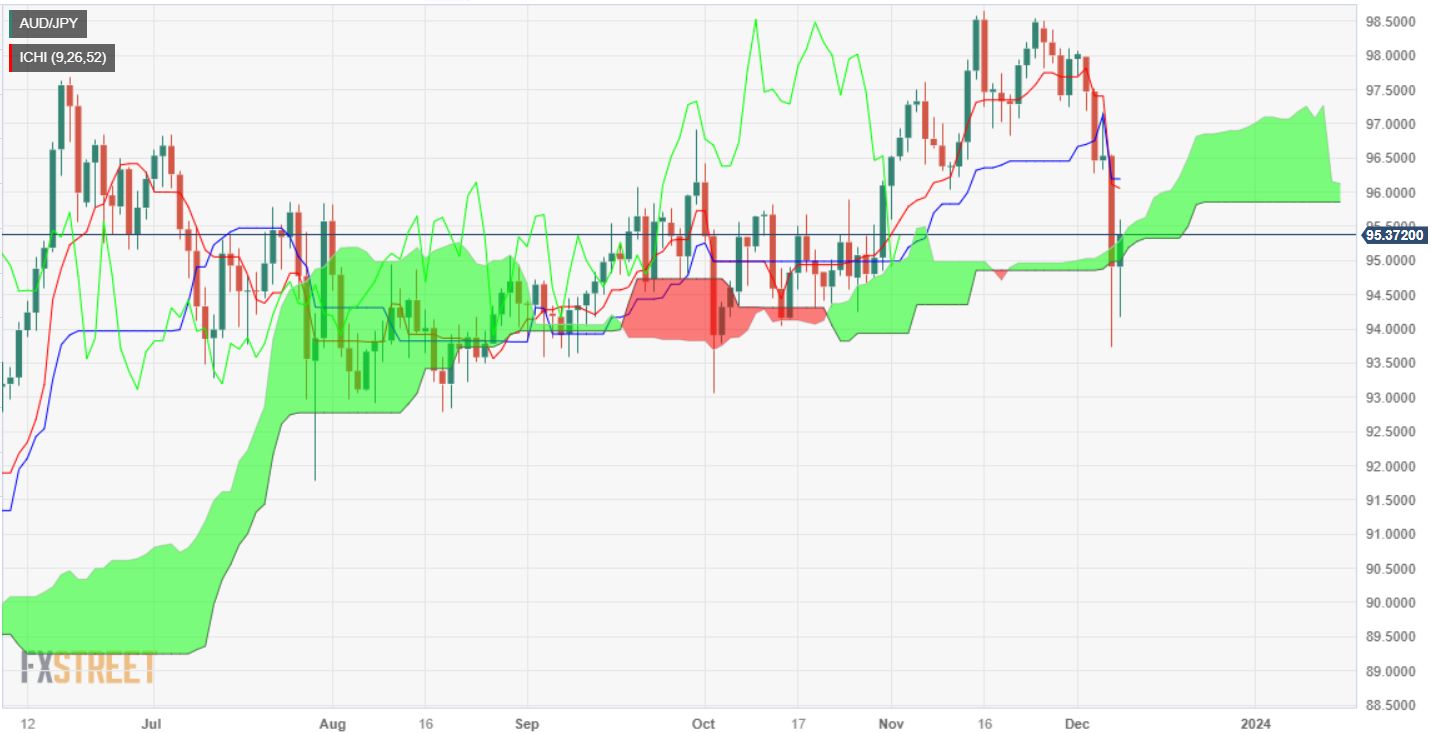
  • Daily chart suggests a neutral to downward bias for the pair, with potential upside risks if a daily close is within Ichimoku Cloud boundaries.
  • A daily close occurs below the top of the Kumo, the potential for further losses; with key support seen at 95.00, followed by a December 8 low of 94.17.
  • Upside resistance includes November 10 swing low-turned resistance at 95.85, ahead of the 96.00 figure, and the Kijun-Sen at 96.14.

The AUD/JPY trimmed some of its Thursday’s losses on Friday, and aims higher 0.27% in late trading during the North American session. Even though the pair is up daily, would finish the week with losses of more than 2.50%, a consequence of comments by Bank of Japan’s (BoJ) Governor Ueda. Therefore, the cross is trading at 95.40, after hitting a daily low of 94.17.

The daily chart portrays the pair as neutral to downward biased, though upside risks remain. If AUD/JPY achieves a daily close within the Ichimoku Cloud (Kumo) boundaries, that could pave the way for further losses; otherwise, the pair could challenge the December 7 high of 96.49.

If AUD/JPY achieves a daily close below the top of the Kumo, the first support would be the 95.00 figure. A breach of the latter will expose the December 8 low of 94.17, ahead of the 94.00 mark

On the upside, if the pair edges above the peak of the Kumo, the first resistance would be the November 10 swing low-turned resistance at 95.85, ahead of the 96.00 figure. The next resistance would be the Kijun-Sen at 96.14.

AUD/JPY Price Analysis – Daily Chart

AUD/JPY Technical Levels

AUD/JPY

Overview
Today last price95.39
Today Daily Change0.48
Today Daily Change %0.51
Today daily open94.91
 
Trends
Daily SMA2097.42
Daily SMA5096.23
Daily SMA10095.34
Daily SMA20093.52
 
Levels
Previous Daily High96.54
Previous Daily Low93.73
Previous Weekly High98.5
Previous Weekly Low97.24
Previous Monthly High98.66
Previous Monthly Low95.61
Daily Fibonacci 38.2%94.8
Daily Fibonacci 61.8%95.47
Daily Pivot Point S193.58
Daily Pivot Point S292.25
Daily Pivot Point S390.76
Daily Pivot Point R196.4
Daily Pivot Point R297.88
Daily Pivot Point R399.21

Author

Christian Borjon Valencia

Christian Borjon began his career as a retail trader in 2010, mainly focused on technical analysis and strategies around it. He started as a swing trader, as he used to work in another industry unrelated to the financial markets.

More from Christian Borjon Valencia
Share:

Markets move fast. We move first.

Orange Juice Newsletter brings you expert driven insights - not headlines. Every day on your inbox.

By subscribing you agree to our Terms and conditions.

Editor's Picks

EUR/USD moves sideways below 1.1800 on Christmas Eve

EUR/USD struggles to find direction and trades in a narrow channel below 1.1800 after posting gains for two consecutive days. Bond and stock markets in the US will open at the usual time and close early on Christmas Eve, allowing the trading action to remain subdued. 

GBP/USD keeps range around 1.3500 amid quiet markets

GBP/USD keeps its range trade intact at around 1.3500 on Wednesday. The Pound Sterling holds the upper hand over the US Dollar amid pre-Christmas light trading as traders move to the sidelines heading into the holiday season. 

Gold retreats from record highs, trades below $4,500

Gold retreats after setting a new record-high above $4,520 earlier in the day and trades in a tight range below $4,500 as trading volumes thin out ahead of the Christmas break. The US Dollar selling bias remains unabated on the back of dovish Fed expectations, which continues to act as a tailwind for the bullion amid persistent geopolitical risks.

Bitcoin slips below $87,000 as ETF outflows intensify, whale participation declines

Bitcoin price continues to trade around $86,770 on Wednesday, after failing to break above the $90,000 resistance. US-listed spot ETFs record an outflow of $188.64 million on Tuesday, marking the fourth consecutive day of withdrawals.

Economic outlook 2026-2027 in advanced countries: Solidity test

After a year marked by global economic resilience and ending on a note of optimism, 2026 looks promising and could be a year of solid economic performance. In our baseline scenario, we expect most of the supportive factors at work in 2025 to continue to play a role in 2026.

Avalanche struggles near $12 as Grayscale files updated form for ETF

Avalanche trades close to $12 by press time on Wednesday, extending the nearly 2% drop from the previous day. Grayscale filed an updated form to convert its Avalanche-focused Trust into an ETF with the US Securities and Exchange Commission.