|

AUD/JPY Price Analysis: Probes the 200-DMA around 92.00

  • Risk aversion weighed on the Australian Dollar, bolstering the safe-haven status of the Japanese Yen.
  • AUD/JPY Price Analysis: Break below the 200-day EMA to exacerbate a fall towards 90.00.

The Australian Dollar (AUD) losses ground against the Japanese Yen (JPY) amid a risk-off impulse as the prospects for a recession in the United States (US) increased, blamed on a worst-than-expected US ISM PMI, and flashed manufacturing activity is deteriorating. At the time of writing, the AUD/JPY is trading at 92.16.

AUD/JPY Price Analysis: Technical outlook

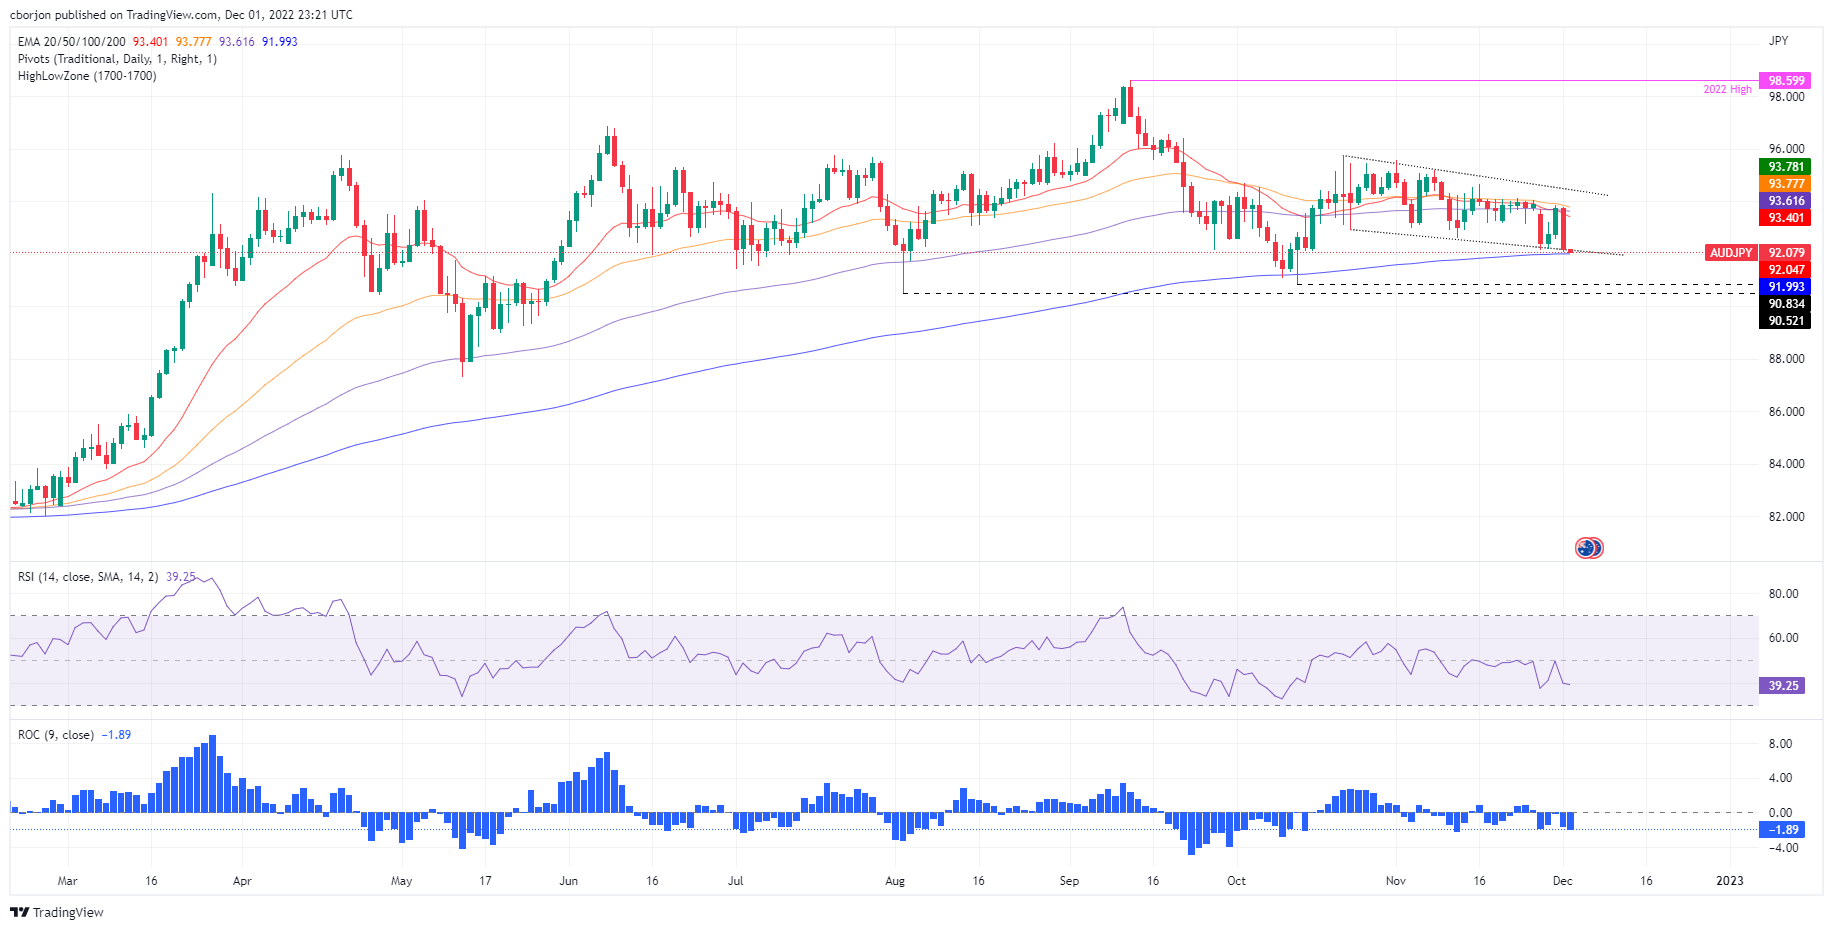
The AUD/JPY daily chart portrays the pair trading within a descending channel, with the 20, 50, and 100-day Exponential Moving Averages (EMAs) sitting above the exchange rate, further confirming the downtrend. Additionally, the AUD/JPY Thursday close below the former weekly low of 92.14, has paved the way for additional losses.

Oscillators with the Relative Strength Index (RSI) at bearish territory, and the 9-day Rate of Change (RoC) aiming downwards, suggests bears are gathering momentum. Therefore, the AUD/JPY path of least resistance is downwards.

The AUD/JPY key support levels are the 200-day EMA at 91.99, followed by the October 13 swing low of 90.83, followed by the August 2 pivot low of 90.52, ahead of the 90.00 figure.

As an alternate scenario, the AUD/JPY first resistance would be the 93.00 figure. Break above will open the AUD/JPY path to the confluence of the 20 and 100-day EMA at 93.40/60, ahead of the 50-day EMA at 93.78

AUD/JPY Key Technical Levels

AUD/JPY

Overview
Today last price92.14
Today Daily Change-1.60
Today Daily Change %-1.71
Today daily open93.74
 
Trends
Daily SMA2093.78
Daily SMA5093.71
Daily SMA10094.32
Daily SMA20092.77
 
Levels
Previous Daily High93.85
Previous Daily Low92.57
Previous Weekly High94.14
Previous Weekly Low93.12
Previous Monthly High95.56
Previous Monthly Low92.15
Daily Fibonacci 38.2%93.36
Daily Fibonacci 61.8%93.06
Daily Pivot Point S192.92
Daily Pivot Point S292.11
Daily Pivot Point S391.64
Daily Pivot Point R194.2
Daily Pivot Point R294.67
Daily Pivot Point R395.48

Author

Christian Borjon Valencia

Markets analyst, news editor, and trading instructor with over 14 years of experience across FX, commodities, US equity indices, and global macro markets.

More from Christian Borjon Valencia
Share:

Editor's Picks

EUR/USD accelerates losses, focus is on 1.1800

EUR/USD’s selling pressure is gathering pace now, opening the door to a potential test of the key 1.1800 region sooner rather than later. The pair’s pullback comes on the back of marked gains in the US Dollar following US data releases and the publication of the FOMC Minutes later in the day.

GBP/USD turns negative near 1.3540

GBP/USD reverses its initial upside momentum and is now adding to previous declines, revisiting at the same time the 1.3540 region on Wednesday. Cable’s downtick comes on the back of decent gains in the Greenback and easing UK inflation figures, which seem to have reinforced the case for a BoE rate cut in March.

Gold battle to regain $5,000 continues

Gold is back on the front foot on Wednesday, shaking off part of the early week softness and challenging two-day highs just above the key $5,000 mark per troy ounce. The move comes ahead of the FOMC Minutes and is unfolding despite an intense rebound in the US Dollar.

Fed Minutes to shed light on January hold decision amid hawkish rate outlook

The Minutes of the Fed’s January 27-28 monetary policy meeting will be published today. Details of discussions on the decision to leave the policy rate unchanged will be scrutinized by investors.

Mixed UK inflation data no gamechanger for the Bank of England

Food inflation plunged in January, but service sector price pressure is proving stickier. We continue to expect Bank of England rate cuts in March and June. The latest UK inflation read is a mixed bag for the Bank of England, but we doubt it drastically changes the odds of a March rate cut.

Sui extends sideways action ahead of Grayscale’s GSUI ETF launch

Sui is extending its downtrend for the second consecutive day, trading at 0.95 at the time of writing on Wednesday. The Layer-1 token is down over 16% in February and approximately 34% from the start of the year, aligning with the overall bearish sentiment across the crypto market.