AUD/JPY Price Analysis: Positive momentum stirs, 103.00 supports hold firm


  • Daily chart indicators reveal a slight recovery from the latest bearish movements of the pair.
  • Signs of a bullish pivot are emerging, intimating a potential decrease in bearish pressure or a hiccup in the consolidation phase.
  • The pair contacts the crucial 20-day SMA at 103.90, which recently began to act as a resistance.

On Monday, the AUD/JPY pair showed signs of stabilizing and rebounded to 103.80, near the 20-day Simple Moving Average (SMA). This could indicate a potential easing of the downward momentum that followed last week's consolidation phase.

Turning attention to the daily Relative Strength Index (RSI) analysis, the index currently stands at 52. Compared to earlier readings, a notable increase suggests the pair's momentum may have taken a bullish turn in the near term. Furthermore, the Moving Average Convergence Divergence (MACD) continues to chart flat red bars, indicating a flattening negative momentum.

AUD/JPY daily chart

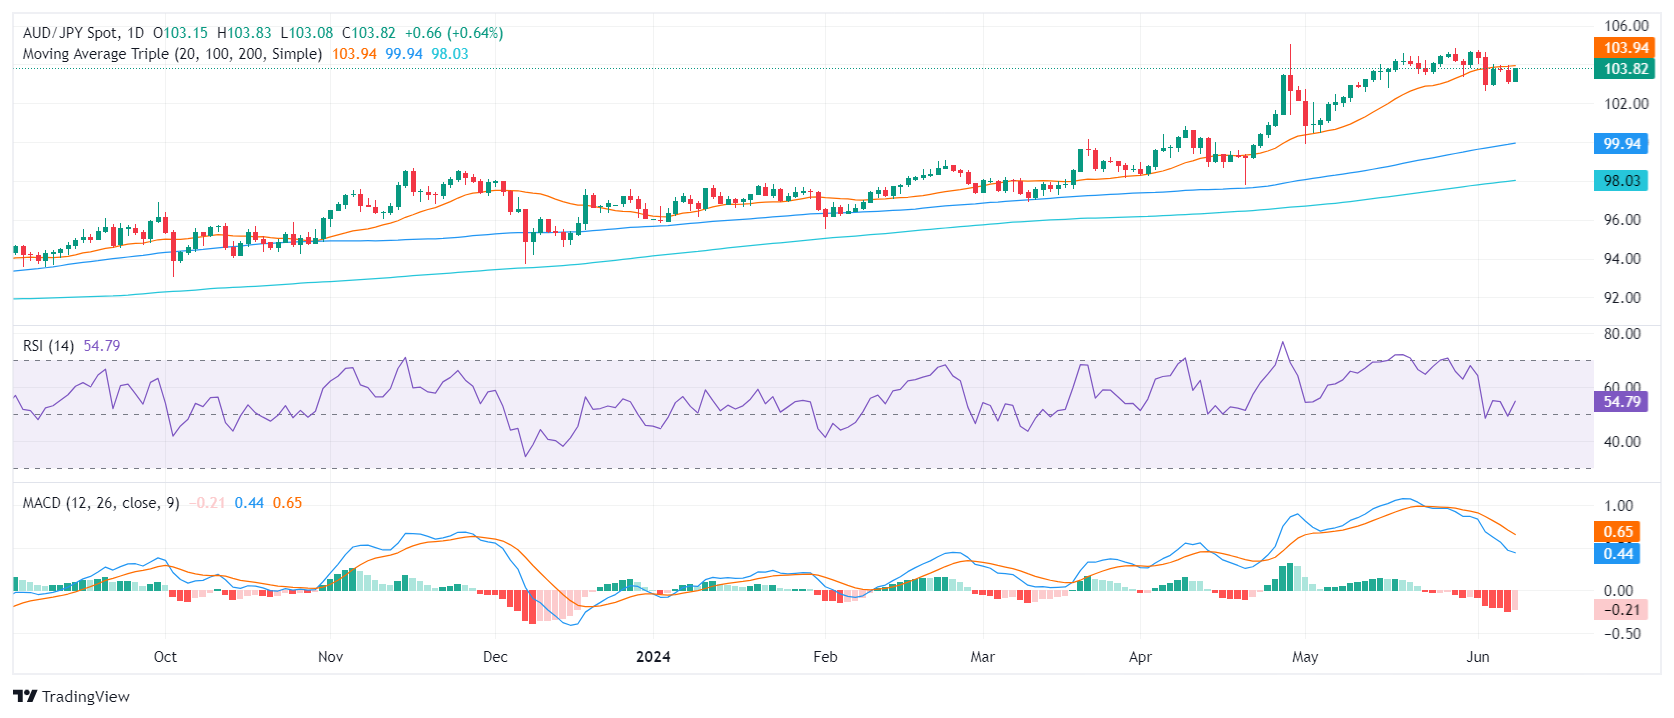
If the pair succumbs to further losses, the 100 and 200-day SMAs provide solid support platforms at around 99.80 and 97.98 respectively. If a bullish reaction propels the pair above the currently challenging 20-day SMA at 103.90, and towards the 105.00 level, significant resistance is to be expected. However, if these resistance barriers hold firm, the AUD/JPY pair may prolong its consolidation stage.

In conclusion, the AUD/JPY pair has encountered strong support at 103.00, indicated by its recent recovery to 103.80 on Monday. This could suggest a potential easing of the bearish pressure unless the pair is able to break through the 20-day SMA of 103.90.


AUD/JPY

Overview
Today last price 103.79
Today Daily Change 0.64
Today Daily Change % 0.62
Today daily open 103.15
 
Trends
Daily SMA20 103.91
Daily SMA50 101.93
Daily SMA100 99.88
Daily SMA200 97.98
 
Levels
Previous Daily High 103.97
Previous Daily Low 102.98
Previous Weekly High 104.73
Previous Weekly Low 102.62
Previous Monthly High 104.87
Previous Monthly Low 99.93
Daily Fibonacci 38.2% 103.36
Daily Fibonacci 61.8% 103.59
Daily Pivot Point S1 102.76
Daily Pivot Point S2 102.38
Daily Pivot Point S3 101.78
Daily Pivot Point R1 103.75
Daily Pivot Point R2 104.35
Daily Pivot Point R3 104.74


Share: Feed news

Information on these pages contains forward-looking statements that involve risks and uncertainties. Markets and instruments profiled on this page are for informational purposes only and should not in any way come across as a recommendation to buy or sell in these assets. You should do your own thorough research before making any investment decisions. FXStreet does not in any way guarantee that this information is free from mistakes, errors, or material misstatements. It also does not guarantee that this information is of a timely nature. Investing in Open Markets involves a great deal of risk, including the loss of all or a portion of your investment, as well as emotional distress. All risks, losses and costs associated with investing, including total loss of principal, are your responsibility. The views and opinions expressed in this article are those of the authors and do not necessarily reflect the official policy or position of FXStreet nor its advertisers. The author will not be held responsible for information that is found at the end of links posted on this page.

If not otherwise explicitly mentioned in the body of the article, at the time of writing, the author has no position in any stock mentioned in this article and no business relationship with any company mentioned. The author has not received compensation for writing this article, other than from FXStreet.

FXStreet and the author do not provide personalized recommendations. The author makes no representations as to the accuracy, completeness, or suitability of this information. FXStreet and the author will not be liable for any errors, omissions or any losses, injuries or damages arising from this information and its display or use. Errors and omissions excepted.

The author and FXStreet are not registered investment advisors and nothing in this article is intended to be investment advice.

Recommended content


Recommended content

Editors’ Picks

EUR/USD bounces off lows, retests 1.1370

EUR/USD bounces off lows, retests 1.1370

Following an early drop to the vicinity of 1.1310, EUR/USD now manages to regain pace and retargets the 1.1370-1.1380 band on the back of a tepid knee-jerk in the US Dollar, always amid growing optimism over a potential de-escalation in the US-China trade war.

EUR/USD News
GBP/USD trades slightly on the defensive in the low-1.3300s

GBP/USD trades slightly on the defensive in the low-1.3300s

GBP/USD remains under a mild selling pressure just above 1.3300 on Friday, despite firmer-than-expected UK Retail Sales. The pair is weighed down by a renewed buying interest in the Greenback, bolstered by fresh headlines suggesting a softening in the rhetoric surrounding the US-China trade conflict.

GBP/USD News
Gold remains offered below $3,300

Gold remains offered below $3,300

Gold reversed Thursday’s rebound and slipped toward the $3,260 area per troy ounce at the end of the week in response to further improvement in the market sentiment, which was in turn underpinned by hopes of positive developments around the US-China trade crisis.

Gold News
Ethereum: Accumulation addresses grab 1.11 million ETH as bullish momentum rises

Ethereum: Accumulation addresses grab 1.11 million ETH as bullish momentum rises

Ethereum saw a 1% decline on Friday as sellers dominated exchange activity in the past 24 hours. Despite the recent selling, increased inflows into accumulation addresses and declining net taker volume show a gradual return of bullish momentum.

Read more
Week ahead: US GDP, inflation and jobs in focus amid tariff mess – BoJ meets

Week ahead: US GDP, inflation and jobs in focus amid tariff mess – BoJ meets

Barrage of US data to shed light on US economy as tariff war heats up. GDP, PCE inflation and nonfarm payrolls reports to headline the week. Bank of Japan to hold rates but may downgrade growth outlook. Eurozone and Australian CPI also on the agenda, Canadians go to the polls.

Read more
The Best brokers to trade EUR/USD

The Best brokers to trade EUR/USD

SPONSORED Discover the top brokers for trading EUR/USD in 2025. Our list features brokers with competitive spreads, fast execution, and powerful platforms. Whether you're a beginner or an expert, find the right partner to navigate the dynamic Forex market.

Read More

Forex MAJORS

Cryptocurrencies

Signatures

Best Brokers of 2025