• The Australian dollar remains in a solid-uptrend vs. the yen, but the market sentiment significantly influences the pair.
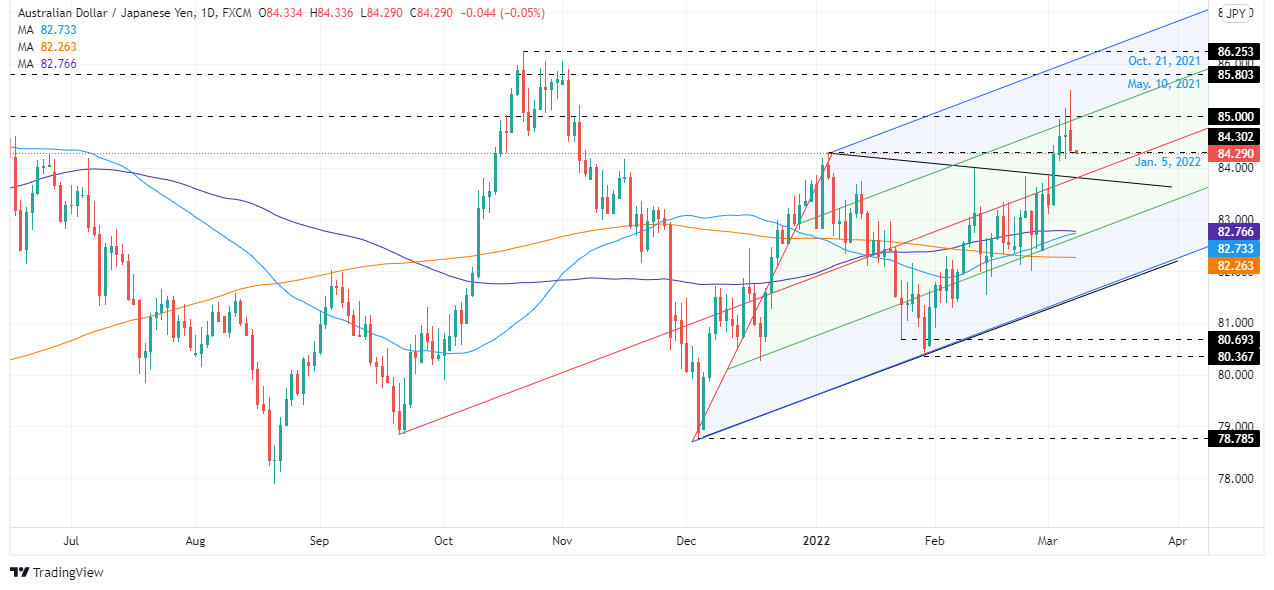
  • AUD/JPY is upward biased might consolidate in the near term around 84.30-85.25.
  • AUD/JPY would remain bullish above 83.00; otherwise could turn bearish due to the closeness of the 50 and 100-day moving averages (DMAs) near the former.

The AUD/JPY was eyeing a solid beginning of the week, reaching a YTD high at 85.50, but a swing in market mood, which previously was ignored by market participants, spurred a 120-pip plunge from daily highs to the daily low around 84.30. At 84.36, the AUD/JPY reflects the risk-aversion in the financial markets, as negotiations between Russia-Ukraine do not abate the conflict.

Monday’s global equity markets finished in a blood bath, with losses between 0.44% and 3.88%. In the FX space, the greenback is the gainer, followed closely by the JPY, which recovered late in the New York session.

AUD/JPY Price Forecast: Technical outlook

The price action in the AUD/JPY depicts the pair as upward biased, though Monday’s rally stalling at 85.50 illustrates exhaustion in the uptrend, though so far is achieving to record the daily close above previous two-day lows. The Average True Range (ATR) of the cross-currency pair is 97 pips, so that would keep the AUD/JPY in consolidation around the 84.30-85.25 area.

If that scenario plays out, the AUD/JPY first resistance would be Pitchfork’s mid-line between the top and the 50% parallel line, around 85.00. Breach of the latter would expose 85.25, followed by 85.50, and next to the confluence of May 10. 2021, and Pitchfork’s top trendline around 85.80-86.00.

On the flip side, it would turn bearish in the near term if AUD/JPY trades below 83.00.

AUD/JPY

Overview
Today last price 84.36
Today Daily Change -0.30
Today Daily Change % -0.35
Today daily open 84.66
 
Trends
Daily SMA20 83.09
Daily SMA50 82.72
Daily SMA100 82.82
Daily SMA200 82.31
 
Levels
Previous Daily High 85.15
Previous Daily Low 84.16
Previous Weekly High 85.15
Previous Weekly Low 82.76
Previous Monthly High 83.99
Previous Monthly Low 80.91
Daily Fibonacci 38.2% 84.77
Daily Fibonacci 61.8% 84.54
Daily Pivot Point S1 84.17
Daily Pivot Point S2 83.67
Daily Pivot Point S3 83.18
Daily Pivot Point R1 85.15
Daily Pivot Point R2 85.64
Daily Pivot Point R3 86.13


Share: Feed news

Information on these pages contains forward-looking statements that involve risks and uncertainties. Markets and instruments profiled on this page are for informational purposes only and should not in any way come across as a recommendation to buy or sell in these assets. You should do your own thorough research before making any investment decisions. FXStreet does not in any way guarantee that this information is free from mistakes, errors, or material misstatements. It also does not guarantee that this information is of a timely nature. Investing in Open Markets involves a great deal of risk, including the loss of all or a portion of your investment, as well as emotional distress. All risks, losses and costs associated with investing, including total loss of principal, are your responsibility. The views and opinions expressed in this article are those of the authors and do not necessarily reflect the official policy or position of FXStreet nor its advertisers. The author will not be held responsible for information that is found at the end of links posted on this page.

If not otherwise explicitly mentioned in the body of the article, at the time of writing, the author has no position in any stock mentioned in this article and no business relationship with any company mentioned. The author has not received compensation for writing this article, other than from FXStreet.

FXStreet and the author do not provide personalized recommendations. The author makes no representations as to the accuracy, completeness, or suitability of this information. FXStreet and the author will not be liable for any errors, omissions or any losses, injuries or damages arising from this information and its display or use. Errors and omissions excepted.

The author and FXStreet are not registered investment advisors and nothing in this article is intended to be investment advice.

Recommended content


Recommended content

Editors’ Picks

EUR/USD flirts with 1.0700 post-US PMIs

EUR/USD flirts with 1.0700 post-US PMIs

EUR/USD maintains its daily gains and climbs to fresh highs near the 1.0700 mark against the backdrop of the resumption of the selling pressure in the Greenback, in the wake of weaker-than-expected flash US PMIs for the month of April.

EUR/USD News

GBP/USD surpasses 1.2400 on further Dollar selling

GBP/USD surpasses 1.2400 on further Dollar selling

Persistent bearish tone in the US Dollar lends support to the broad risk complex and bolsters the recovery in GBP/USD, which manages well to rise to fresh highs north of 1.2400 the figure post-US PMIs.

GBP/USD News

Gold trims losses on disappointing US PMIs

Gold trims losses on disappointing US PMIs

Gold (XAU/USD) reclaims part of the ground lost and pares initial losses on the back of further weakness in the Greenback following disheartening US PMIs prints.

Gold News

Here’s why Ondo price hit new ATH amid bearish market outlook Premium

Here’s why Ondo price hit new ATH amid bearish market outlook

Ondo price shows no signs of slowing down after setting up an all-time high (ATH) at $1.05 on March 31. This development is likely to be followed by a correction and ATH but not necessarily in that order.

Read more

Germany’s economic come back

Germany’s economic come back

Germany is the sick man of Europe no more. Thanks to its service sector, it now appears that it will exit recession, and the economic future could be bright. The PMI data for April surprised on the upside for Germany, led by the service sector.

Read more

Forex MAJORS

Cryptocurrencies

Signatures