|

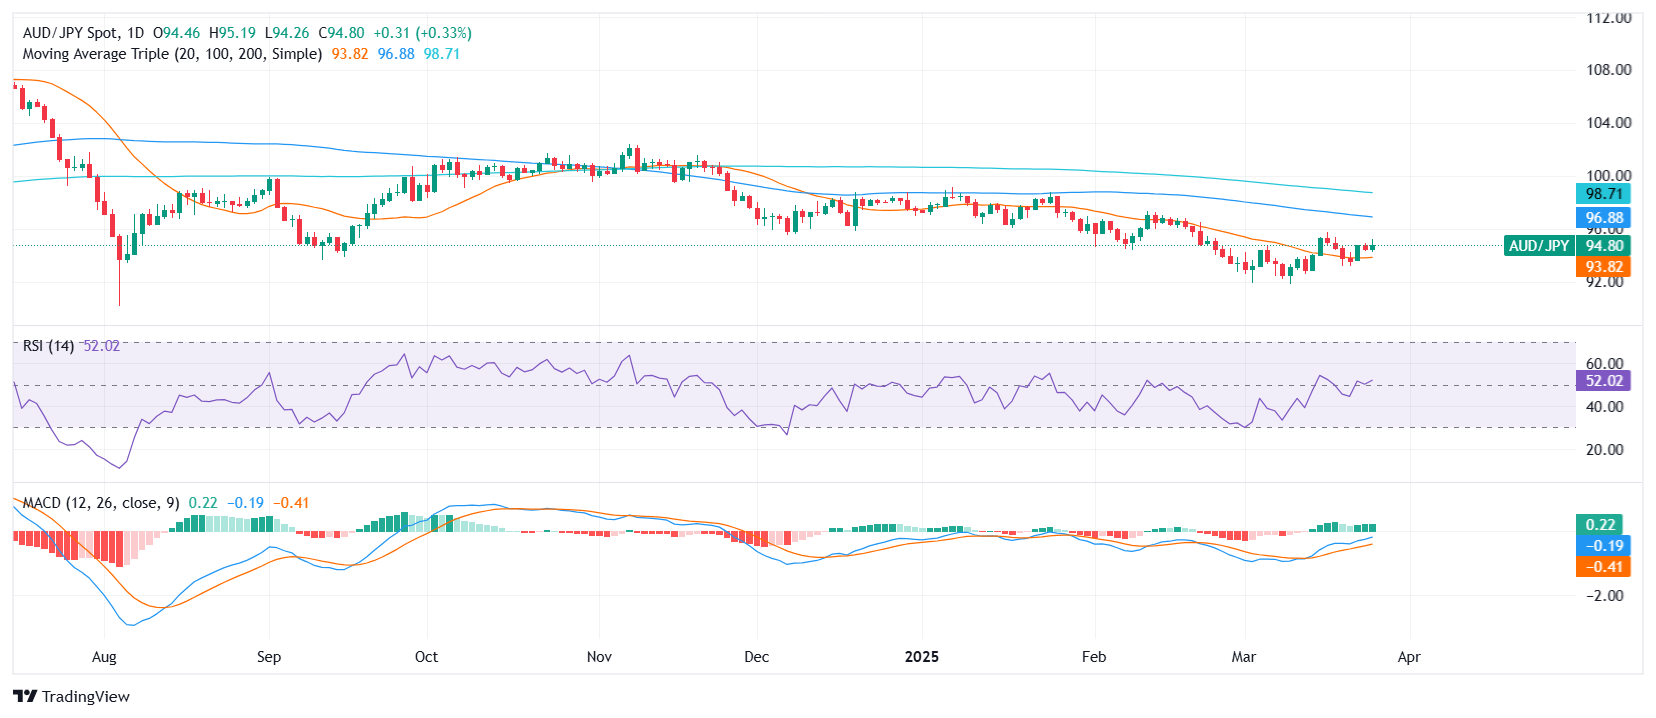
AUD/JPY Price Analysis: Moves near 94.70 with conflicting signals limiting directional conviction

  • AUD/JPY was seen trading near the 94.70 zone on Wednesday, holding mid-range after a mild advance.
  • Momentum indicators flash mixed cues, with short-term bias tilted higher but overbought risks emerging.
  • Support lies around 94.60–94.42, while resistance caps gains near the 95.20–96.45 zone.

The AUD/JPY pair edged slightly higher on Wednesday’s session ahead of the Asian open, seen trading around the 94.70 area. After bouncing from earlier lows, the pair managed to extend its recovery, though intraday action remains confined within the mid-point of its daily range, with a mixed technical setup keeping broader trends in check.

From a momentum perspective, the MACD histogram signals a potential buy. Meanwhile, the Ichimoku Base Line near 94.30 maintains a neutral stance. The Relative Strength Index stands at 51 and the Stochastic oscillator at 71, both hovering in neutral territory, yet the combined RSI/Stochastic indicator printing near 85 raises early overbought warnings.

The moving average analysis shows the 20-day Simple Moving Average at 93.88, supporting upside momentum in the short term. However, longer-term pressure remains, as both the 100-day SMA at 96.98 and 200-day SMA at 98.80 continue to slope downward, suggesting that underlying bearish risk remains in play.

In terms of key levels, immediate support is seen around 94.60, followed by 94.47 and 94.42. On the flip side, resistance is expected at 95.22 and 95.36, with a break above the latter potentially opening the door for a test of 96.45.

AUD/JPY daily chart

Author

Patricio Martín

Patricio is an economist from Argentina passionate about global finance and understanding the daily movements of the markets.

More from Patricio Martín
Share:

Editor's Picks

EUR/USD keeps the offered stance just above 1.1700

EUR/USD is coming under heavy selling pressure in what has been a rather grim start to the new trading week, with the pair now trading close to the 1.1700 support area as the US Dollar stages a solid rebound. The prevailing flight to safety mood continues to favour the Greenback, as investors react to the escalating conflict in the Middle East and trim risk exposure across the board.

GBP/USD hits new yearly lows near 1.3300

GBP/USD adds to the recent bearish tone, approaching to the key 1.3300 support to reach fresh YTD troughs against the backdrop of the robust performance of the US Dollar. Indeed, Cable’s decline comes amid the firm demand for the safe-haven space in the wake of the US and Israel attacks to Iran.

Gold trims losses, back below $5,400

Gold now surrenders part of the earlier advance past the $5,400 mark per troy ounce at the beginning of the week. Indeed, the precious metal’s strong uptick remains fuelled by increasing geopolitical tensions in the Middle East amid the intense demand for safer assets.

Bitcoin on brink of breakdown amid US-Iran war

Bitcoin (BTC) remains under pressure near the key support level of $65,700. Trading at $66,400 at the time of writing on Monday, a breakdown below this critical level would suggest a deeper correction ahead.

The Fed is finally talking about AI – Here's why it matters for the US Dollar

AI is moving from earnings calls into the heart of monetary policy discussions, forcing Federal Reserve officials to confront a new question: How to act if AI reshapes inflation, employment and interest rates at the same time?

Pi Network Price Forecast: Core team offloads supply, weighing on PI recovery

Pi Network  hovers below $0.1700, broadly steady at press time on Monday, attempting a recovery after a 2% loss the previous day. Sunday’s decline aligned with nearly 49 million PI tokens offloaded by the Pi Foundation, implying a spike in supply pressure that capped the prevailing four-day recovery.