|

AUD/JPY Price Analysis: Hovers around 95.00 as bearish signals emerge

  • AUD/JPY remains largely unchanged at 95.01, but recent price action suggests a possible correction could be on the horizon.
  • The pair has formed a ‘bearish-harami’ candlestick pattern on the daily chart, indicating potential downside risks.
  • Short-term outlook turns bearish as the pair falls below the Kumo.

The Australian Dollar (AUD) trimmed some of its last week’s gains versus the Japanese Yen (JPY), which dropped 0.05% on Monday. However, as the Tuesday Asian session begins, the AUD/JPY hovers at around 95.01, unchanged.

From a daily chart perspective, the AUD/JPY is neutral to upward biased. Still, price action during the last couple of days suggests the cross-currency pair is headed for a correction, as it formed a ‘bearish-harami’ candlestick pattern formed by an inverted hammer and a doji. Hence, the cross-first support would be the 95.00 figure, followed by the top of the Ichimoku Cloud (Kumo) at 94.74, followed by the Tenkan-Sen line at 94.56, and followed by the Kijun-Sen at 94.17.

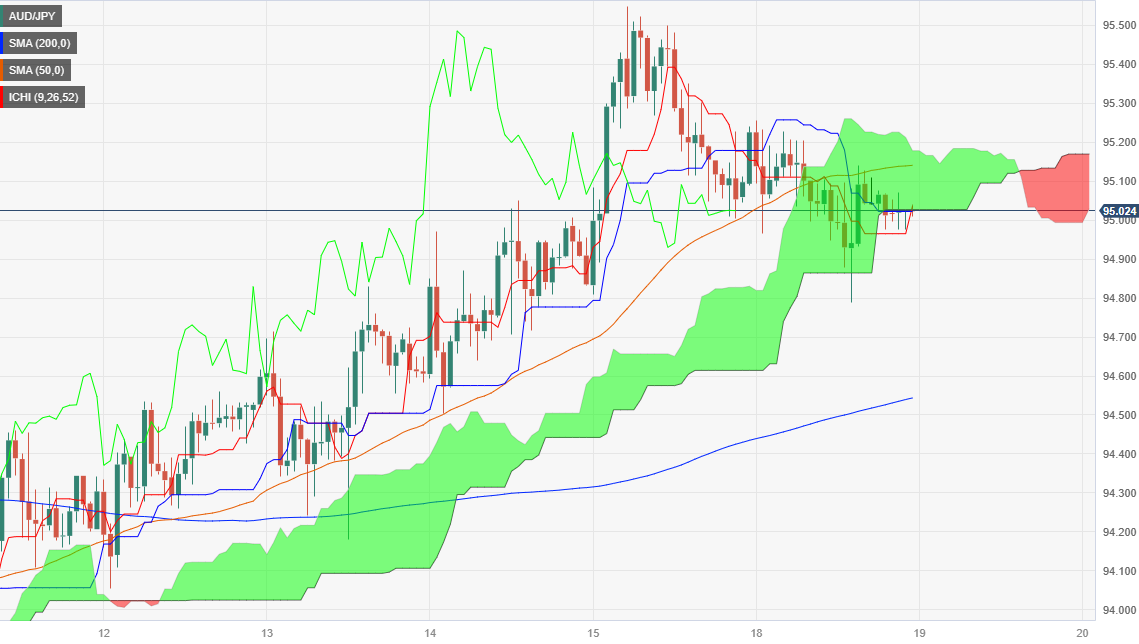
Short-term, the cross-currency pair has fallen below the Kumo, suggesting the pair turned bearish bias. To resume its downtrend, AUD/JPY sellers must drag prices below the September 18 swing low of 94.78. That would reaffirm the bearish bias and open the door to test the September 14 swing low of 94.50, followed by an upslope support trendline around 94.20/40. A decisive break and the 94.00 threshold would be next.

AUD/JPY Price Action – Hourly chart

AUD/JPY Technical Levels

AUD/JPY

Overview
Today last price95.02
Today Daily Change-0.09
Today Daily Change %-0.09
Today daily open95.11
 
Trends
Daily SMA2094.29
Daily SMA5094.29
Daily SMA10093.81
Daily SMA20092.03
 
Levels
Previous Daily High95.55
Previous Daily Low94.81
Previous Weekly High95.55
Previous Weekly Low93.65
Previous Monthly High95.81
Previous Monthly Low92.79
Daily Fibonacci 38.2%95.27
Daily Fibonacci 61.8%95.09
Daily Pivot Point S194.76
Daily Pivot Point S294.41
Daily Pivot Point S394.02
Daily Pivot Point R195.5
Daily Pivot Point R295.9
Daily Pivot Point R396.24
 

Author

Christian Borjon Valencia

Markets analyst, news editor, and trading instructor with over 14 years of experience across FX, commodities, US equity indices, and global macro markets.

More from Christian Borjon Valencia
Share:

Editor's Picks

EUR/USD faces some resistance near 100-SMA on H4, around 1.1830 zone

The EUR/USD pair gains some follow-through positive traction for the second consecutive day and climbs to the 1.1830 region during the Asian session on Thursday. The US Dollar remains on the back foot amid concerns about the economic fallout from US President Donald Trump's erratic trade policies and acts as a tailwind for spot prices.

GBP/USD extends recovery to near 20-day EMA as US Dollar weakens

The Pound Sterling holds onto weekly gains around 1.3565 against the US Dollar during the Asian trading session on Thursday. The GBP/USD pair trades firmly as the US Dollar remains under pressure due to uncertainty surrounding the United States trade policy outlook.

Gold struggle with $5,200 extends ahead of more US-Iran talks

Gold is replicating the recovery moves seen in Wednesday’s Asian trading early Thursday, as buyers continue to flirt with the $5,200 level. Sustained US Dollar weakness and looming US-Iran talks aid the bright metal’s rebound.  

Top Crypto Gainers: Polkadot, Near Protocol, Uniswap lead market rebound

Altcoins, such as Polkadot, Near Protocol, and Uniswap, are leading gains over the last 24 hours as Bitcoin jumped 6% on Wednesday. The altcoins are holding steady at press time on Thursday following a rebound the previous day, testing the waters around their 50-day Exponential Moving Average. 

Nvidia delivers another monster earnings report, and forecasts big things to come

It was another monster earnings report from Nvidia for fiscal Q4. Revenues were $68.1bn, smashing estimates of $65bn. Gross profit margin was a healthy 75%, up from 73.5% in the prior quarter, and the outlook for this quarter was monstrous.

Cosmos Hub Price Forecast: ATOM rebounds slightly, bearish outlook remains intact

Cosmos Hub (ATOM) price rebounds, trading above $2.05 at the time of writing on Wednesday, after undergoing a sharp correction since last week. Weakening on-chain and derivatives data support a bearish outlook, while technical analysis remains unfavorable.