|

AUD/JPY Price Analysis: Gains traction near 94.70, within an ascending trend channel

  • AUD/JPY trades in positive territory for four straight days on Thursday.
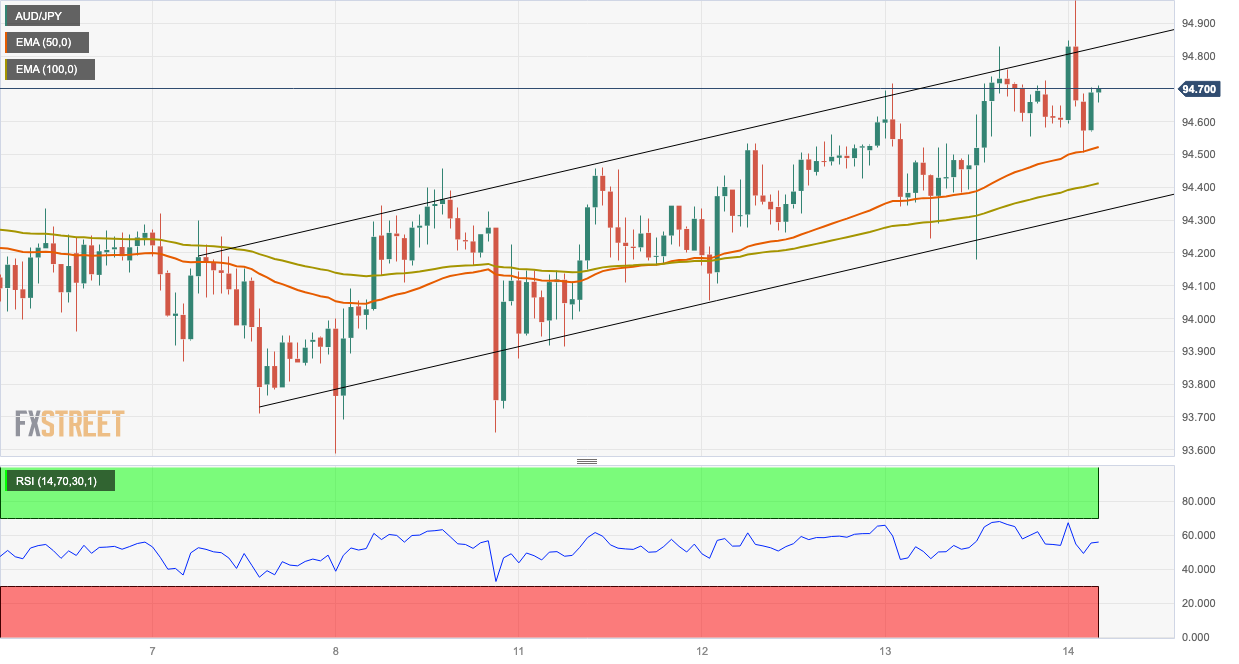
  • The immediate resistance level for AUD/JPY emerges at 94.82; the initial support level is seen at 94.40.
  • Relative Strength Index (RSI) holds above 50 in the bullish territory.

The AUD/JPY cross gains momentum for the fourth consecutive day during the Asian session on Thursday. The cross currently trades around 94.70, up 0.01% on the day. The Aussie attracts some buyers following the release of Employment data. However, markets anticipate that the Reserve Bank of Australia (RBA) might have already ended its rate-hiking cycle, which could cap the upside of the AUD/JPY.

The Australian Bureau of Statistics (ABS) revealed on Thursday that Australia’s Unemployment Rate came in at 3.7% in August compared to 3.7% in the previous reading and was in line with the expectation. Meanwhile, the number of employed people rose to 64.9K in August, compared to a market consensus of 23K and a loss of 14.6K in the previous month.

From the technical outlook, AUD/JPY trades within an ascending trend channel since September 7 on the one-hour chart. That said, the path of least resistance for the AUD/JPY is to the upside as the cross holds above the 50- and 100-hour Exponential Moving Averages (EMAs).

The immediate resistance level for AUD/JPY emerges near the upper boundary of an ascending trend channel at 94.82. Any follow-through buying above the latter will see a rally to a confluence of a psychological round mark and a high of August 30 at 95.00. The next upside stop to watch is 95.40 (high of July 14) en route to 95.85 (high of July 31).

Looking at the downside, the cross will meet the initial support level at 94.40 (the 100-hour EMA). The next downside filter appears at 94.30 (the lower limit of the descending trend channel). A break below the latter will see a drop to 94.00 (a low of September 5) en route to 93.50 (a low of August 22) and finally near a psychological figure at 93.00.

It’s worth noting that the Relative Strength Index (RSI) holds above 50 in the bullish territory, which support the buyers for now.

AUD/JPY one-hour chart

AUD/JPY

Overview
Today last price94.69
Today Daily Change0.00
Today Daily Change %0.00
Today daily open94.69
 
Trends
Daily SMA2094.12
Daily SMA5094.3
Daily SMA10093.7
Daily SMA20092
 
Levels
Previous Daily High94.83
Previous Daily Low94.18
Previous Weekly High94.72
Previous Weekly Low93.59
Previous Monthly High95.81
Previous Monthly Low92.79
Daily Fibonacci 38.2%94.58
Daily Fibonacci 61.8%94.43
Daily Pivot Point S194.31
Daily Pivot Point S293.92
Daily Pivot Point S393.66
Daily Pivot Point R194.96
Daily Pivot Point R295.22
Daily Pivot Point R395.6

Author

Lallalit Srijandorn

Lallalit Srijandorn is a Parisian at heart. She has lived in France since 2019 and now becomes a digital entrepreneur based in Paris and Bangkok.

More from Lallalit Srijandorn
Share:

Markets move fast. We move first.

Orange Juice Newsletter brings you expert driven insights - not headlines. Every day on your inbox.

By subscribing you agree to our Terms and conditions.

Editor's Picks

EUR/USD struggles to extend advance above 1.1800

The EUR/USD pair posts a fresh weekly low near 1.1740 during the Asian trading session on Wednesday. The major currency pair is under pressure as the US Dollar edges higher despite Federal Open Market Committee minutes of the December policy meeting, released on Tuesday, showing that most policymakers stressed the need for further interest rate cuts.

GBP/USD tests 1.3450 support after moving below nine-day EMA

GBP/USD remains subdued for the second consecutive day, trading around 1.3460 during the Asian hours on Wednesday. The technical analysis of the daily chart indicates a weakening of a bullish bias as the pair is positioned slightly below the lower boundary of the ascending channel pattern.

Gold jumps on US rate cut prospects, safe-haven demand

Gold price extends the rally above $4,350 during the early European trading hours on Wednesday. Gold's price has surged about 65% this year and is set to record its biggest annual gains since 1979. The rally in the precious metal is bolstered by the prospect of further US interest rate cuts in 2026. Lower interest rates could reduce the opportunity cost of holding Gold, supporting the non-yielding precious metal.

Bitcoin, Ethereum and XRP prepare for a potential New Year rebound

Bitcoin, Ethereum, and Ripple are holding steady on Wednesday after recording minor gains on the previous day. Technically, Bitcoin could extend gains within a triangle pattern while Ethereum and Ripple face critical overhead resistance. 

Economic outlook 2026-2027 in advanced countries: Solidity test

After a year marked by global economic resilience and ending on a note of optimism, 2026 looks promising and could be a year of solid economic performance. In our baseline scenario, we expect most of the supportive factors at work in 2025 to continue to play a role in 2026.

Crypto market outlook for 2026

Year 2025 was volatile, as crypto often is.  Among positive catalysts were favourable regulatory changes in the U.S., rise of Digital Asset Treasuries (DAT), adoption of AI and tokenization of Real-World-Assets (RWA).