|

AUD/JPY Price Analysis: Dives deep inside the Kumo after breaking a support trendline

  • AUD/JPY extends losses for three straight days, breaking below a five-month support trendline at 93.40/50, registering marginal gains of 0.05%.
  • The pair exhibits a downward bias, with indicators such as the Kijun and Tenkan-Sen lines signaling bearish momentum following the BoJ's tweaks to YCC.
  • Key support lies at the bottom of the Kumo at 92.78, with potential further downside to 91.78. Resistance can be found at the Tenkan-Sen at 93.82, with potential moves towards 94.00.

The AUD/JPY broke below a five-month-old support trendline at around 93.40/50 and extended its losses to three straight days, with the pair getting deep inside the Ichimoku Cloud (Kumo), about to turn bearish as the Asian session begins. At the time of writing, the AUD/JPY is trading at 93.37, registering minuscule gains of 0.05%.

AUD/JPY Price Analysis: Technical outlook

From a daily chart perspective, the AUD/JPY remains downward biased, with price action already below the Kijun and Tenkan- Sen lines, while the Chikou Span lies below the June 30 low, which sits at 95.59. In addition, the AUD/JPY breaking below a support trendline confirms that sellers are gathering momentum following the Bank of Japan (BoJ) decision to tweak the Yield Curve Control (YCC).

That said, AUD/JPY traders must be aware of volatility levels increasing in most Japanese Yen (JPY) pairs. Also, the AUD/JPY would remain subject to market sentiment, which could turn worse, if global equities continue to drop.

Hence, the AUD/JPY path of least resistance is downwards. The first support would be the bottom of the Kumo at 92.78, which once cleared, could pave the way to test the July 28 low at 91.78. Conversely, if AUD/JPY achieves a daily close above the Tenkan-Sen at 93.82, that will set a move towards 94.00. Further upside, could put in risk, Thursday’s high of  94.08.

AUD/JPY Price Action – Daily chart
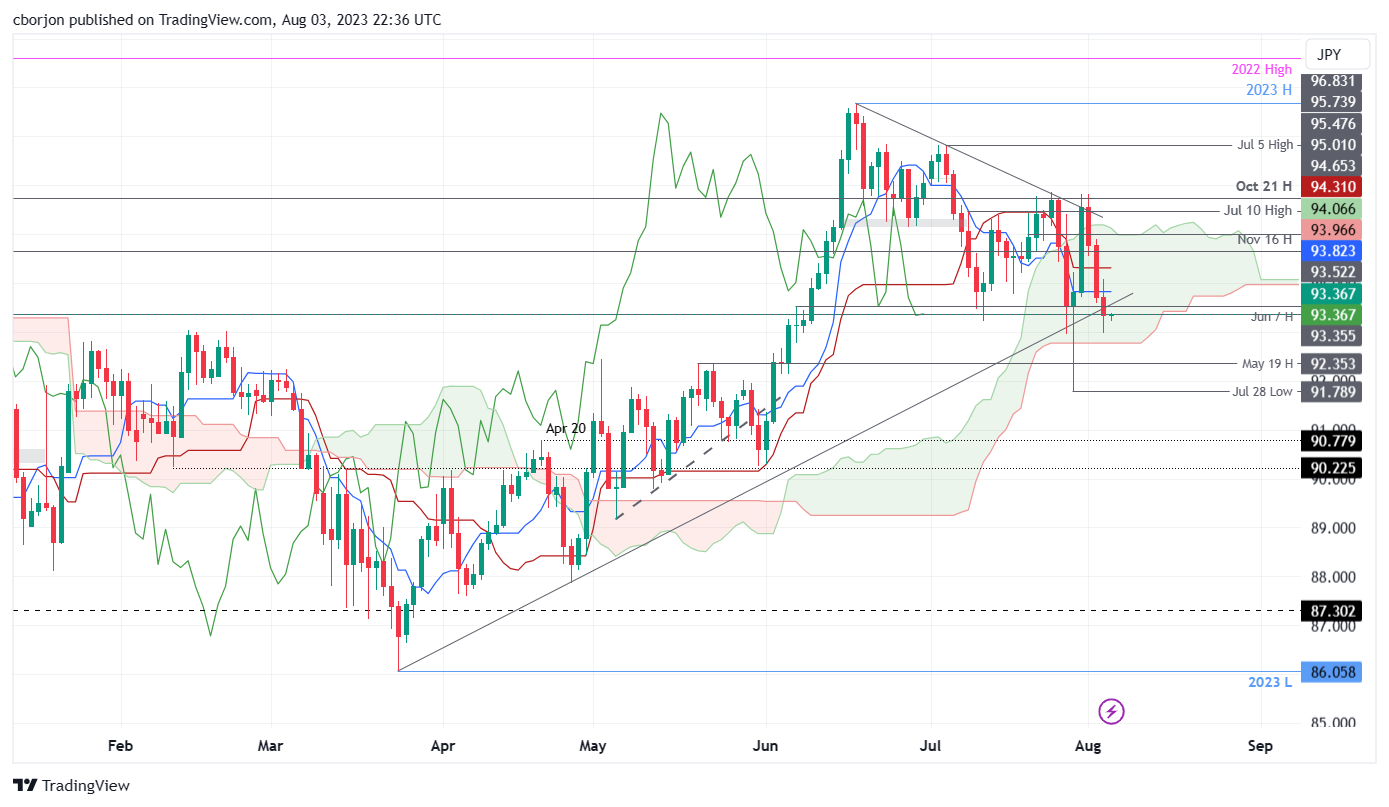
AUD/JPY Daily chart

AUD/JPY

Overview
Today last price93.39
Today Daily Change-0.33
Today Daily Change %-0.35
Today daily open93.72
 
Trends
Daily SMA2094.71
Daily SMA5094.6
Daily SMA10092.14
Daily SMA20091.93
 
Levels
Previous Daily High94.9
Previous Daily Low93.59
Previous Weekly High95.86
Previous Weekly Low91.79
Previous Monthly High96.84
Previous Monthly Low91.79
Daily Fibonacci 38.2%94.09
Daily Fibonacci 61.8%94.4
Daily Pivot Point S193.24
Daily Pivot Point S292.76
Daily Pivot Point S391.93
Daily Pivot Point R194.55
Daily Pivot Point R295.38
Daily Pivot Point R395.86
 

Author

Christian Borjon Valencia

Markets analyst, news editor, and trading instructor with over 14 years of experience across FX, commodities, US equity indices, and global macro markets.


More from Christian Borjon Valencia
Share:

Editor's Picks

AUD/USD hangs near three-week low, below 0.6950 as traders await US NFP report

AUD/USD hits a three-week low during the Asian session on Friday as the RBA’s dovish shift and a rout in equity markets weigh on the risk-sensitive Aussie. However, the recent slump in US bond yields to a two-month low keeps US Dollar bulls on the back foot and limits losses for the currency pair as traders look to the US NFP report for a fresh impetus.

USD/JPY bounces off three-week low; keeps the red near 157.65 as focus remains on US NFP

USD/JPY bounces off the weekly low set during the Asian session, as bears turn cautious ahead of the US NFP report due later this Friday. The upside seems limited as the recent slump in US bond yields and hopes of Iran war de-escalation undermine the US Dollar. Moreover, a hawkish BoJ and intervention risks support the Japanese Yen, capping the pair.

Gold loses the grip; $4,000 comes next on the downside

Gold sets aside two daily advances in a row on Friday, opening the door to a potential test of the key $4,000 mark per troy ounce. The precious metal’s retracement follows a decent improvement in the sentiment surrounding the US Dollar, solid NFP data and higher US Treasury yields across the board.

Democrats win House and Senate in US midterms: Why isn’t all bad news for crypto

The biggest story this week was Tuesday’s US midterm elections, which saw Democrats win control of both the House and the Senate in a clear blue wave. This political shift in the US has triggered sharp price swings across the cryptocurrency market.

Week ahead – Inflation and geopolitics in focus as US political landscape shifts

Post-midterm election euphoria fizzles out as risk aversion prevails. US CPI, PPI and Fedspeak on the radar as Fed hike bets remain supported. Oil retreat pauses on mixed hopes about the ongoing conflicts.

US Dollar breaks below 101.50 as Democrats sweep Congress
The US Dollar (USD) comes under heavy selling pressure on Wednesday, with the US Dollar Index (DXY) falling around 0.5% to trade near 101.35 after sliding below the 101.50 level. The Greenback retreats to its lowest level in four weeks as investors reassess the political and economic outlook following the Democratic Party's sweeping victory in the United States (US) midterm elections.