|

AUD/JPY Price Analysis: Consolidation phase continues, bearish pressure observed

  • Daily chart indicators reveal a neutral period for the pair; RSI stands at 49, showcasing no strong directional bias.
  • Signs of a bearish takeover are emerging, suggesting possible short-term bearish pressure or further consolidation.
  • The pair now interacts with the important 20-day SMA at 103.90, which currently serves as resistance to recover.

During the last trading sessions of this week, the AUD/JPY pair is maneuvering around the 103.00 level. This is indicative of an ongoing consolidation period following the impressive rally since early May.

Shifting the attention to the daily Relative Strength Index (RSI) analysis, the index is sitting at 49. When compared to the previous readings, a clear decline suggests that the pair has entered a bearish momentum in the short term. Moreover, the Moving Average Convergence Divergence (MACD) has started printing flat red bars, signaling that the market is experiencing steady selling activity.

AUD/JPY daily chart

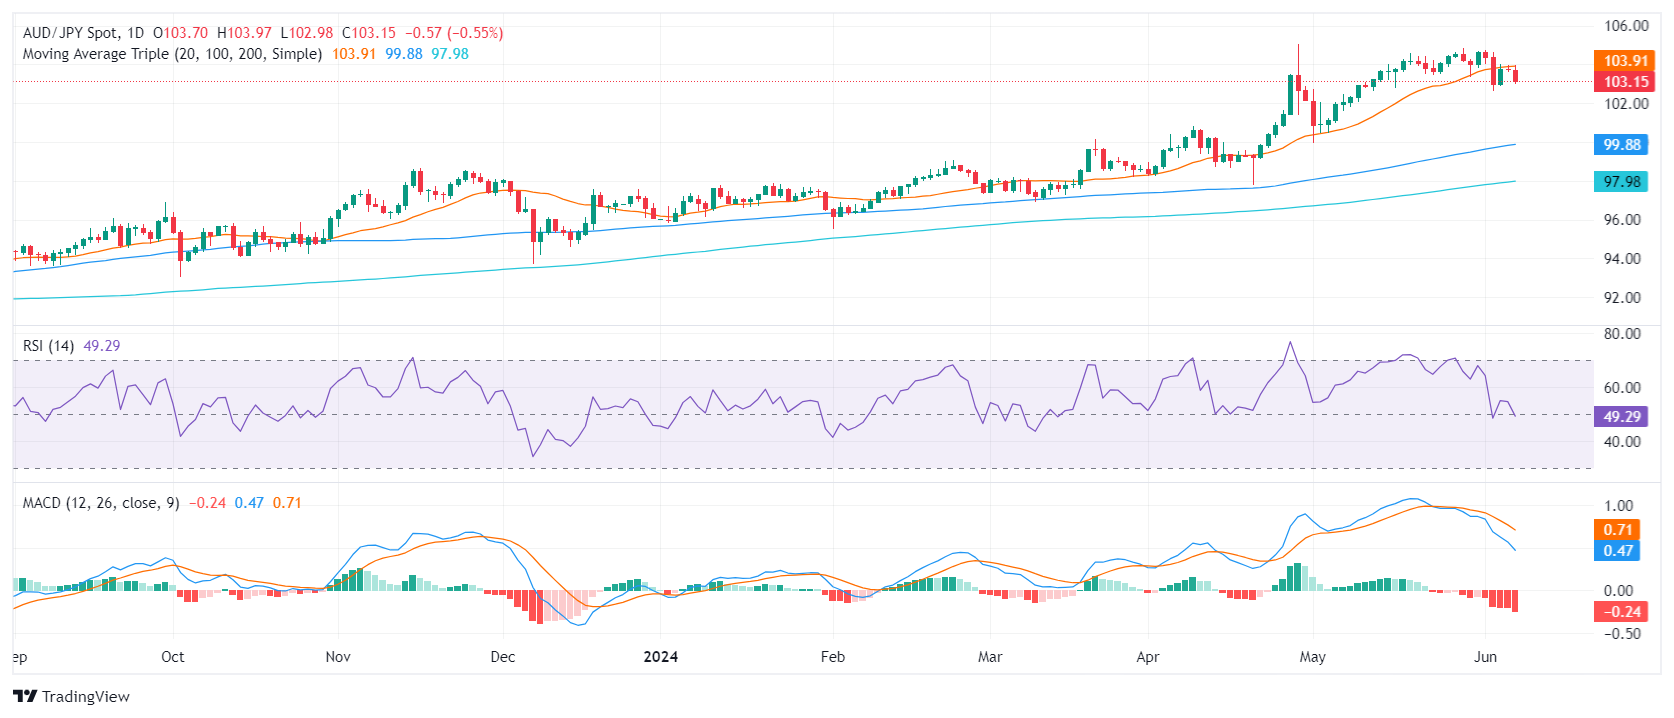
Should the pair suffer further losses, the 100 and 200-day SMAs are readily available as buffering units. These averages are situated at about 99.80 and 97.98, respectively. Conversely, any attempt by the bulls to push the pair above the aforementioned 20-day SMA and further to the 105.00 level will be met with resistance. If these resistance barriers remain unbroken, the AUD/JPY pair might extend its consolidation phase.

AUD/JPY

Overview
Today last price103.15
Today Daily Change-0.57
Today Daily Change %-0.55
Today daily open103.72
 
Trends
Daily SMA20103.89
Daily SMA50101.84
Daily SMA10099.82
Daily SMA20097.94
 
Levels
Previous Daily High103.98
Previous Daily Low103.62
Previous Weekly High104.87
Previous Weekly Low103.36
Previous Monthly High104.87
Previous Monthly Low99.93
Daily Fibonacci 38.2%103.76
Daily Fibonacci 61.8%103.84
Daily Pivot Point S1103.57
Daily Pivot Point S2103.41
Daily Pivot Point S3103.2
Daily Pivot Point R1103.93
Daily Pivot Point R2104.14
Daily Pivot Point R3104.3

Author

Patricio Martín

Patricio is an economist from Argentina passionate about global finance and understanding the daily movements of the markets.

More from Patricio Martín
Share:

Editor's Picks

AUD/USD stays bid above 0.7100 on Australian trade data, Mideast optimism

AUD/USD clings to minor recovery gains above 0.7100 in the Asian session on Thursday as a new Israel-Lebanon ceasefire keeps a lid on the safe-haven US Dollar. Meanwhile, strong AustralianTrade Balane data also help the Aussie pair sustain the bounce from weekly lows.

USD/JPY hovers near the 160.00 intervention threshold on Mideast tensions

USD/JPY struggles to find acceptance above 160.00 and retreats from a one-month high in the Asian session on Thursday amid fears that authorities will step in again to prop up the Japanese Yen. Furthermore, a new Israel-Lebanon ceasefire caps the US Dollar and supports the currency pair. However, renewed US-Iran tensions keep the downside limited in the Greenback and the pair.

Gold rebounds from one-week low as Israel-Lebanon truce pressures safe-haven USD

Gold gains some positive traction on Thursday and climbs to the $4,475 area during the Asian session, reversing a major part of the previous day's slide to a one-week low. The Israel-Lebanon truce prompts some profit-taking around the US Dollar and supports the commodity. 


Ethereum: Long-term holders' capitulation drives ETH below $1,800

Ethereum has fallen below $1,800 on Wednesday, the first time since May 2025 following accelerated spot selling pressure and distributions from long-term holders. The Age Consumed metric, which tracks the movement of previously idle tokens or long-term holders' coins, spiked over the past two days as prices declined, indicating increased selling activity among this cohort.

Kevin Warsh takes the Fed helm: What it means for the US Dollar
The Federal Reserve moves away from the highly predictable "forward guidance" model of the Jerome Powell era to a new “Kevin Warsh environment”, characterized by less communication, more policy surprises, and an increased focus on the Fed's complex balance sheet.
Recession on paper: What really moves the Canadian Loonie now?

Statistics Canada handed the headline writers a gift and the analysts a headache. Real GDP shrank 0.1% on an annualized basis in the first quarter, and with the fourth quarter of 2025 revised down to a 1.0% contraction, that is two negative quarters in a row, the textbook definition of a technical recession and Canada's first since the pandemic.