|

AUD/JPY Price Analysis: Buyers consolidate, sellers challenge the 20-day SMA support

  • The AUD/JPY pair witnesses further descent, as the ongoing profit-taking causes it to approach the reinforced 20-day SMA support.
  • Should the bulls manage to establish robust support at the 20-day SMA, the next potential target appears to exist within the 104.50-105.00 price range.

In Friday's session, the AUD/JPY pair further descended as buyers continued to realize their profits, which led to the pair falling briefly below the 20-day Simple Moving Average (SMA) at 103.60, only to regain ground above the 104.00 mark. This bounce-back signals that the 20-day SMA has assumed the role of a robust support line. Nevertheless, the ongoing consolidation phase suggests a lack of drive for a significant surge.

On a daily scale, the Relative Strength Index (RSI) now reads 56, a slightly lower figure from Thursday's reading of 57. This indicates a marginal downward trend, signaling a potential easing of the previous upward momentum. Conversely, the Moving Average Convergence Divergence (MACD) continues to print flat red bars, signifying a stable selling momentum.

AUD/JPY daily chart

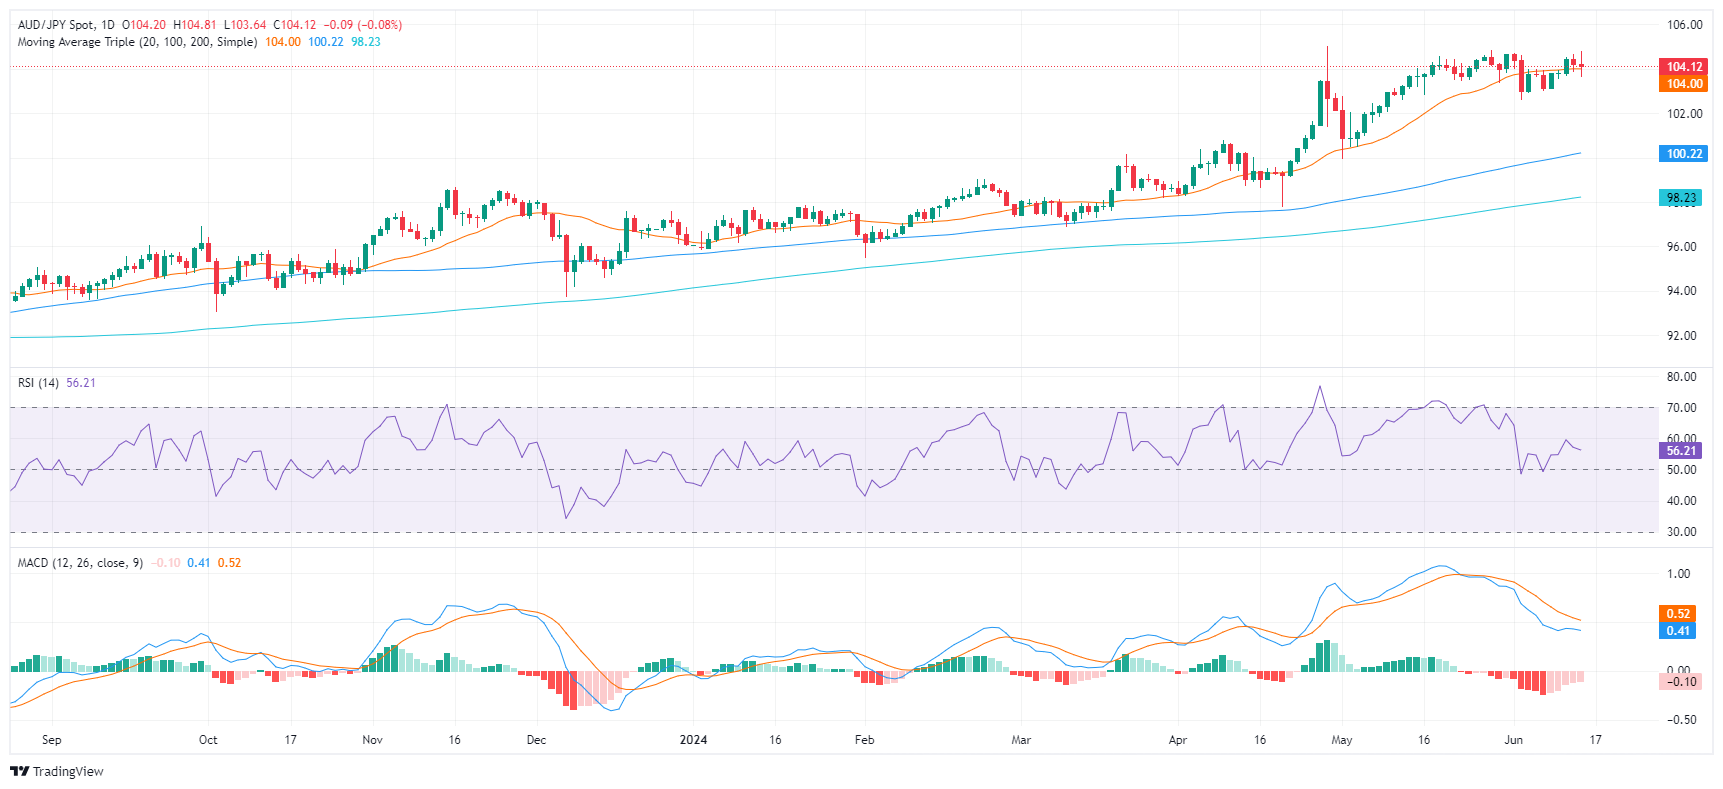
To wrap up, the AUD/JPY pair exhibits signs of ongoing consolidation, despite Friday's further descent, with trading activity concentrated around the 20-day SMA. The range of 102.00-104.00 for the imminent sessions could be indicative of continued side-ways trading as bulls look to consolidate the gains from May's rally that propelled the pair near the 105.00 mark.

Nonetheless, the consolidation could suggest the bulls are preparing for the next upward movement, potentially aiming for the 104.50-105.00 range once again. In contrast, a breach of the 20-day SMA could tempt the bears, with further supports lining up at 102.60, and the long-term 100 and 200-day SMAs, which reside in the 100.00 and 98.00 zone.

AUD/JPY

Overview
Today last price104.1
Today Daily Change-0.10
Today Daily Change %-0.10
Today daily open104.2
 
Trends
Daily SMA20104
Daily SMA50102.33
Daily SMA100100.15
Daily SMA20098.18
 
Levels
Previous Daily High104.69
Previous Daily Low103.85
Previous Weekly High104.73
Previous Weekly Low102.62
Previous Monthly High104.87
Previous Monthly Low99.93
Daily Fibonacci 38.2%104.17
Daily Fibonacci 61.8%104.37
Daily Pivot Point S1103.81
Daily Pivot Point S2103.41
Daily Pivot Point S3102.97
Daily Pivot Point R1104.64
Daily Pivot Point R2105.09
Daily Pivot Point R3105.48

Author

Patricio Martín

Patricio is an economist from Argentina passionate about global finance and understanding the daily movements of the markets.

More from Patricio Martín
Share:

Editor's Picks

AUD/USD falls to near 0.7100 after slipping below 50-day EMA

AUD/USD depreciates after registering minor gains in the previous day, trading around 0.7120 during the Asian hours. The technical analysis of the daily chart shows the pair consolidating sideways within a rectangle pattern, as neither bulls nor bears gain control. The AUD/USD pair is holding a slight bearish tone however as it sits beneath both the nine-day and 50-day EMAs.

160.00: USD/JPY back near intervention territory after upbeat US jobs report

US Nonfarm Payrolls beat expectations by a wide margin in May, with 172K jobs added. The US Dollar rebounds after the release, helping USD/JPY recover from its intraday lows. Warnings from Japanese authorities continue to limit upside potential near the 160.00 threshold.

Gold targets $4,300 amid stronger Dollar

Gold faces increasing selling interest and navigates the area of three-month lows near the $4,300 mark per troy ounce on Friday. The precious metal’s decline comes as traders assess the stronger-than-expected NFP, while the bid bias in the Greenback and higher US Treasury yields also collaborate with the retracement.

Cardano hits five-year low even as Hoskinson clarifies "break" isn't an exit

Cardano (ADA) price is down 10% at press time on Friday, extending losses over 30% so far this week amid Charles Hoskinson's clarification that "break" isn't an exit.

Week ahead – Fed countdown begins amid US inflation data and geopolitical risks

Fed Chair Warsh’s first meeting approaches as key US inflation data could reshape expectations. Oil prices remain elevated as US-Iran talks continue; tariffs also return to the spotlight. ECB is expected to hike; will it be a one-off move or is July live?

The US economy defies the rules: 100 days into the Oil shock and the recession signal is still missing

More than three months after the start of the Iran war and the resulting disruption to global energy markets, the US economy continues to display remarkable resilience. The conflict has triggered a sharp rise in Oil prices, reignited inflationary pressures and fueled widespread concerns about a potential economic slowdown.