|

AUD/JPY Price Analysis: Bulls display signs of fatigue, potential shift remains possible

  • Daily chart indicators suggest a slowdown in buying traction with RSI positioned above 70 indicating overbought conditions.
  • Hourly chart indicators weaken, implying the possibility of short-term losses in the upcoming Asian session.
  • The bulls might not have enough traction to retest the cycle highs above 105.00.

In Tuesday's session, the AUD/JPY pair continued to edge higher, securing some gains but at a seemingly slower pace, stabilizing around the 104.60 mark. Given the extended upward phase with 15 gains out of the last 19 sessions, buyers may be showing signs of fatigue. The market could be heading towards a short-term correction as indicators flash overbought signals.

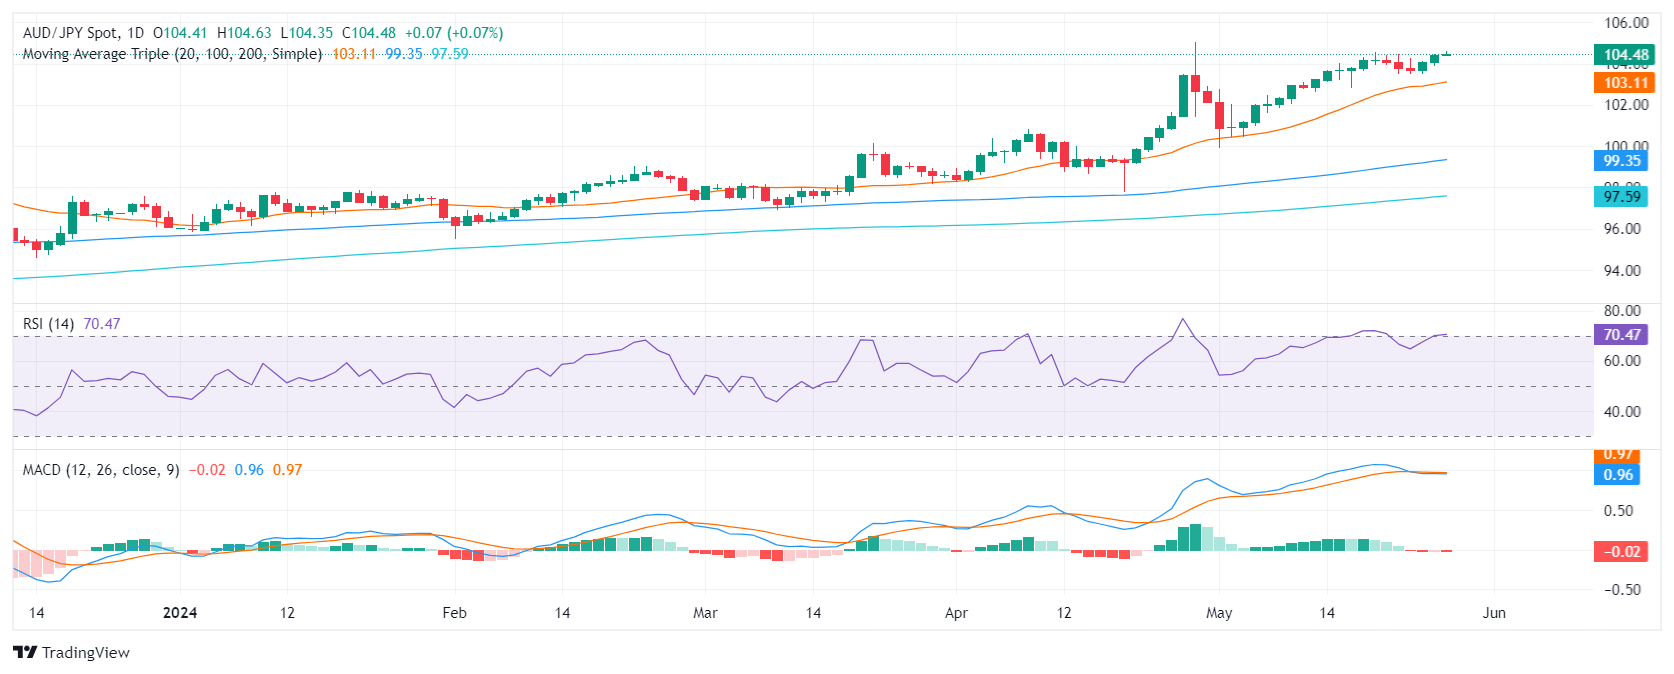
On the daily chart, the RSI has inched above the 70 territory, an area typically considered overbought. This situation, along with the MACD producing red bars, suggests that while buyers still hold control, their grip is loosening.

AUD/JPY daily chart

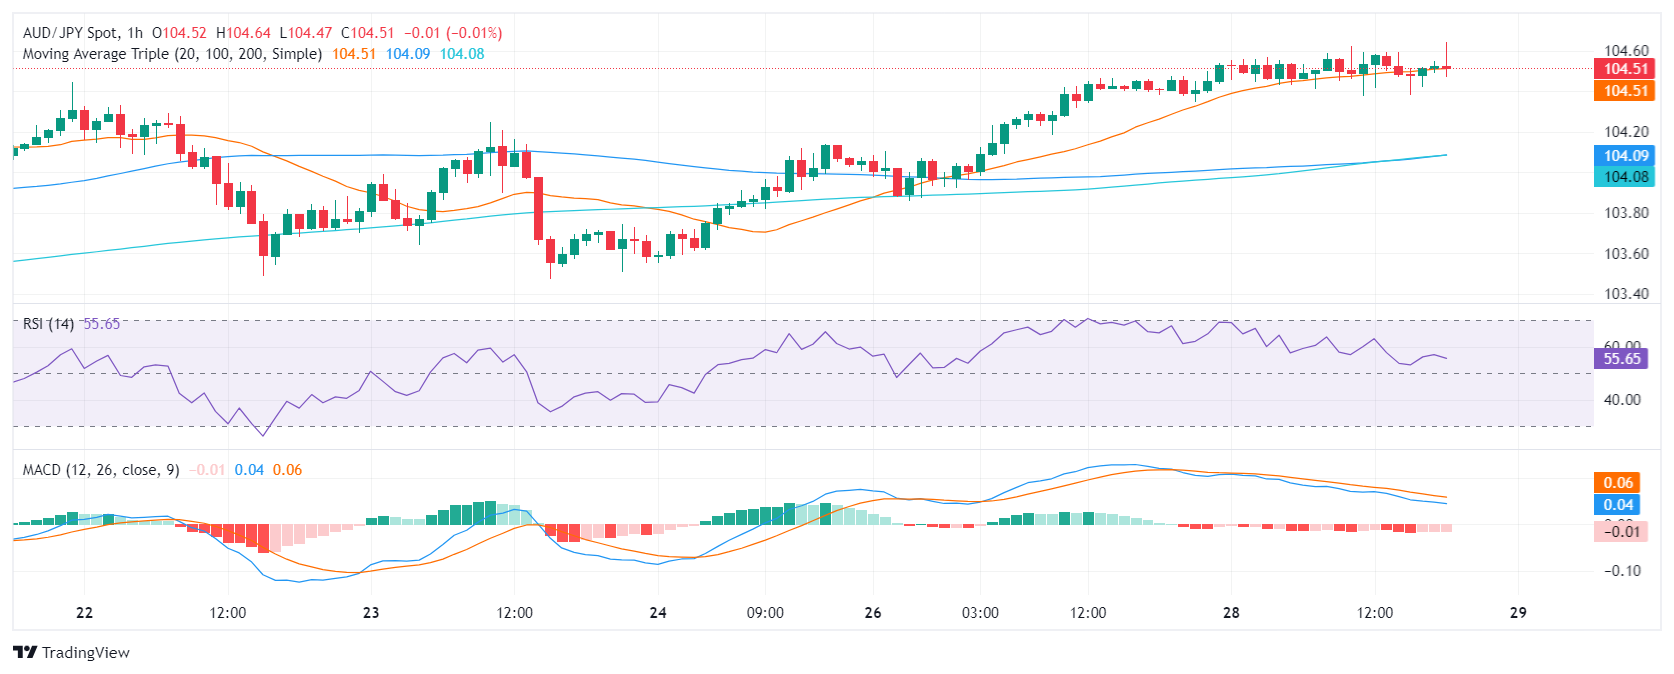
The hourly chart portrays similar sentiments. The RSI is nearing 50 and displays a downward bias. Concurrently, the MACD prints rising red bars, hinting at a weakening bullish momentum in the near term.

AUD/JPY hourly chart

Zooming out for the big picture, the AUD/JPY continues to trade above all three key Simple Moving Average (SMA) benchmarks of 20, 100, and 200 days, affirming a bullish perspective. However, with the pair stabilizing around multi-year highs, and overt signs of buyer exhaustion, the possibility of a near-term correction is becoming increasingly apparent. The main resistance is the cycle high just above 105.00 while the 20-day SMA at 103.12 offers itself as a strong support.

AUD/JPY

Overview
Today last price104.5
Today Daily Change0.09
Today Daily Change %0.09
Today daily open104.41
 
Trends
Daily SMA20103
Daily SMA50101.03
Daily SMA10099.27
Daily SMA20097.54
 
Levels
Previous Daily High104.46
Previous Daily Low103.86
Previous Weekly High104.56
Previous Weekly Low103.48
Previous Monthly High105.04
Previous Monthly Low97.78
Daily Fibonacci 38.2%104.23
Daily Fibonacci 61.8%104.09
Daily Pivot Point S1104.03
Daily Pivot Point S2103.64
Daily Pivot Point S3103.42
Daily Pivot Point R1104.63
Daily Pivot Point R2104.85
Daily Pivot Point R3105.24

Author

Patricio Martín

Patricio is an economist from Argentina passionate about global finance and understanding the daily movements of the markets.

More from Patricio Martín
Share:

Editor's Picks

EUR/USD sticks to positive bias above 1.1800 as trade jitters undermine USD

The EUR/USD pair builds on the previous day's modest gains and attracts some buyers for the second straight day on Thursday amid a softer US Dollar. Spot prices, however, lack bullish conviction and trade around the 1.1815-1.1820 area during the Asian session, up 0.10% for the day.

GBP/USD extends recovery to near 20-day EMA as US Dollar weakens

The Pound Sterling holds onto weekly gains around 1.3565 against the US Dollar during the Asian trading session on Thursday. The GBP/USD pair trades firmly as the US Dollar remains under pressure due to uncertainty surrounding the United States trade policy outlook.

Gold struggle with $5,200 extends ahead of more US-Iran talks

Gold is replicating the recovery moves seen in Wednesday’s Asian trading early Thursday, as buyers continue to flirt with the $5,200 level. Sustained US Dollar weakness and looming US-Iran talks aid the bright metal’s rebound.  

Top Crypto Gainers: Polkadot, Near Protocol, Uniswap lead market rebound

Altcoins, such as Polkadot, Near Protocol, and Uniswap, are leading gains over the last 24 hours as Bitcoin jumped 6% on Wednesday. The altcoins are holding steady at press time on Thursday following a rebound the previous day, testing the waters around their 50-day Exponential Moving Average. 

Nvidia delivers another monster earnings report, and forecasts big things to come

It was another monster earnings report from Nvidia for fiscal Q4. Revenues were $68.1bn, smashing estimates of $65bn. Gross profit margin was a healthy 75%, up from 73.5% in the prior quarter, and the outlook for this quarter was monstrous.

Cosmos Hub Price Forecast: ATOM rebounds slightly, bearish outlook remains intact

Cosmos Hub (ATOM) price rebounds, trading above $2.05 at the time of writing on Wednesday, after undergoing a sharp correction since last week. Weakening on-chain and derivatives data support a bearish outlook, while technical analysis remains unfavorable.