|

AUD/JPY Price Analysis: Bulls advance to multi-week highs, consolidation incoming

  • The AUD/JPY rose in Monday's session at 97.60 with a gain of 0.23%.
  • Hourly chart shows RSI and MACD dip, highlighting short-term buyers' shift to consolidate gains.
  • The overall trend still favors the bulls.

In Monday's session, the AUD/JPY is trading at 97.60, registering a gain of 0.23%. The pair has seen a recent push from the buyers, which made indicators reach overbought territory and now indicators are consolidating. The overall trend still favors the buyers as the pair is still above its main Simple Moving Averages (SMAs)

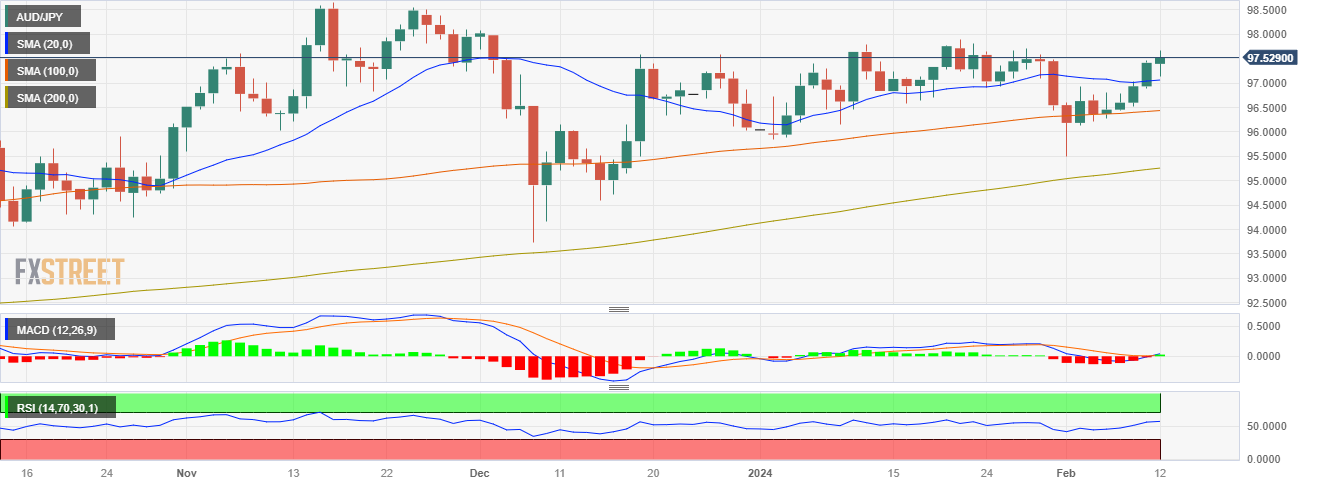
Analyzing the daily chart, the Relative Strength Index (RSI), which resides within the positive territory, continues to show an increasing trend, suggesting that buyers are currently exerting pressure on the market. This aligns with the Moving Average Convergence Divergence (MACD) histogram, which printed a green bar implying that the bulls jumped back a into positive territory.

Concentrating on the hourly chart, the RSI dipped back from the overbought area struck earlier in the session to the positive domain, hinting at a more balanced, albeit still buyers-favoured, market in recent hours. In line with that, the MACD histogram has been rising, throughout the session but now seems to have flattened as buyers are taking a breather.

Taking the pairs' position into account relative to its main Simple Moving Averages (SMAs), the broader trend is on the buyer's side, as the pair is above the 20, 100, and 200-day SMAs. Yet, for the rest of the session, the cross may continue side-ways trade to consolidate the gains from its recent push.

AUD/JPY daily chart

AUD/JPY

Overview
Today last price97.59
Today Daily Change0.17
Today Daily Change %0.17
Today daily open97.42
 
Trends
Daily SMA2097.04
Daily SMA5096.67
Daily SMA10096.42
Daily SMA20095.23
 
Levels
Previous Daily High97.46
Previous Daily Low96.88
Previous Weekly High97.46
Previous Weekly Low96.22
Previous Monthly High97.88
Previous Monthly Low95.84
Daily Fibonacci 38.2%97.24
Daily Fibonacci 61.8%97.1
Daily Pivot Point S197.04
Daily Pivot Point S296.67
Daily Pivot Point S396.46
Daily Pivot Point R197.62
Daily Pivot Point R297.83
Daily Pivot Point R398.21

Author

Patricio Martín

Patricio is an economist from Argentina passionate about global finance and understanding the daily movements of the markets.

More from Patricio Martín
Share:

Editor's Picks

EUR/USD looks weak below 1.1800

EUR/USD has slipped back under pressure, breaking through the 1.1800 support and drifting towards the weekly lows near 1.1770 ahead of the opening bell in Asia. The move reflects renewed strength in the US Dollar, with steady geopolitical tensions keeping its demand firm. Moving forward, the release of the German labour market report and flash inflation figures should keep European investors entertained on Friday.
 

GBP/USD threatens the 200-day SMA near 1.3440

GBP/USD rapidly leaves behind Wednesday’s strong advance, coming under heavy pressure and retesting the 1.3440 zone, where the critical 200-day SMA is located. Cable’s deep pullback follows the strong gains in the Greenback, while investors continue to pencil in a potential BoE rate cut in March.

Gold trims gains, slips back to around $5,170

Gold is now facing some downside pressure, hovering around the $5,170 region on Thursday. The yellow metal surrenders part of its earlier gains on the back of the resurgence of the buying interest in the Greenback. In the meantime, geopolitical tensions in the Middle East continue to limit the downside potential for now.

How AI, blockchain, stablecoins are shaping a new global economy – Circle CEO Jeremy Allaire

Artificial Intelligence (AI), blockchain technology and stablecoins are emerging as core pillars of a new global economic system, according to Circle’s CEO, Jeremy Allaire.

Changing the game: International implications of recent tariff developments

The Supreme Court ruling on International Emergency Economic Powers Act (IEEPA) tariffs provides limited relief for the rest of the world, with weighted average tariff rates modestly lower.

Bitcoin steadies as traders eye US–Iran talks

Bitcoin (BTC) price is stabilizing around $68,000 at the time of writing on Thursday after a 6.2% relief rally the previous day amid a broader downward trend.