|

AUD/JPY Price Analysis: Bullish harami emerged amidst sentiment improvement

  • AUD/JPY formed a bullish harami candle pattern, suggesting the pair is upward biased.
  • However, oscillators are still pointing south, so caution is warranted.
  • AUD/JPY Price Analysis: Once it clears 89.00, that would pave the way toward 90.00.

The AUD/JPY trimmed some of its Monday losses on Tuesday and gained 0.16%. The pair formed a bullish harami two-candle pattern that could open the door for further gains, but firstly it needs to the region the 89.00 figure. At the time of writing, the AUD/JPY is trading at 88.32, up 0.01% as the Asian session begins.

AUD/JPY Price action

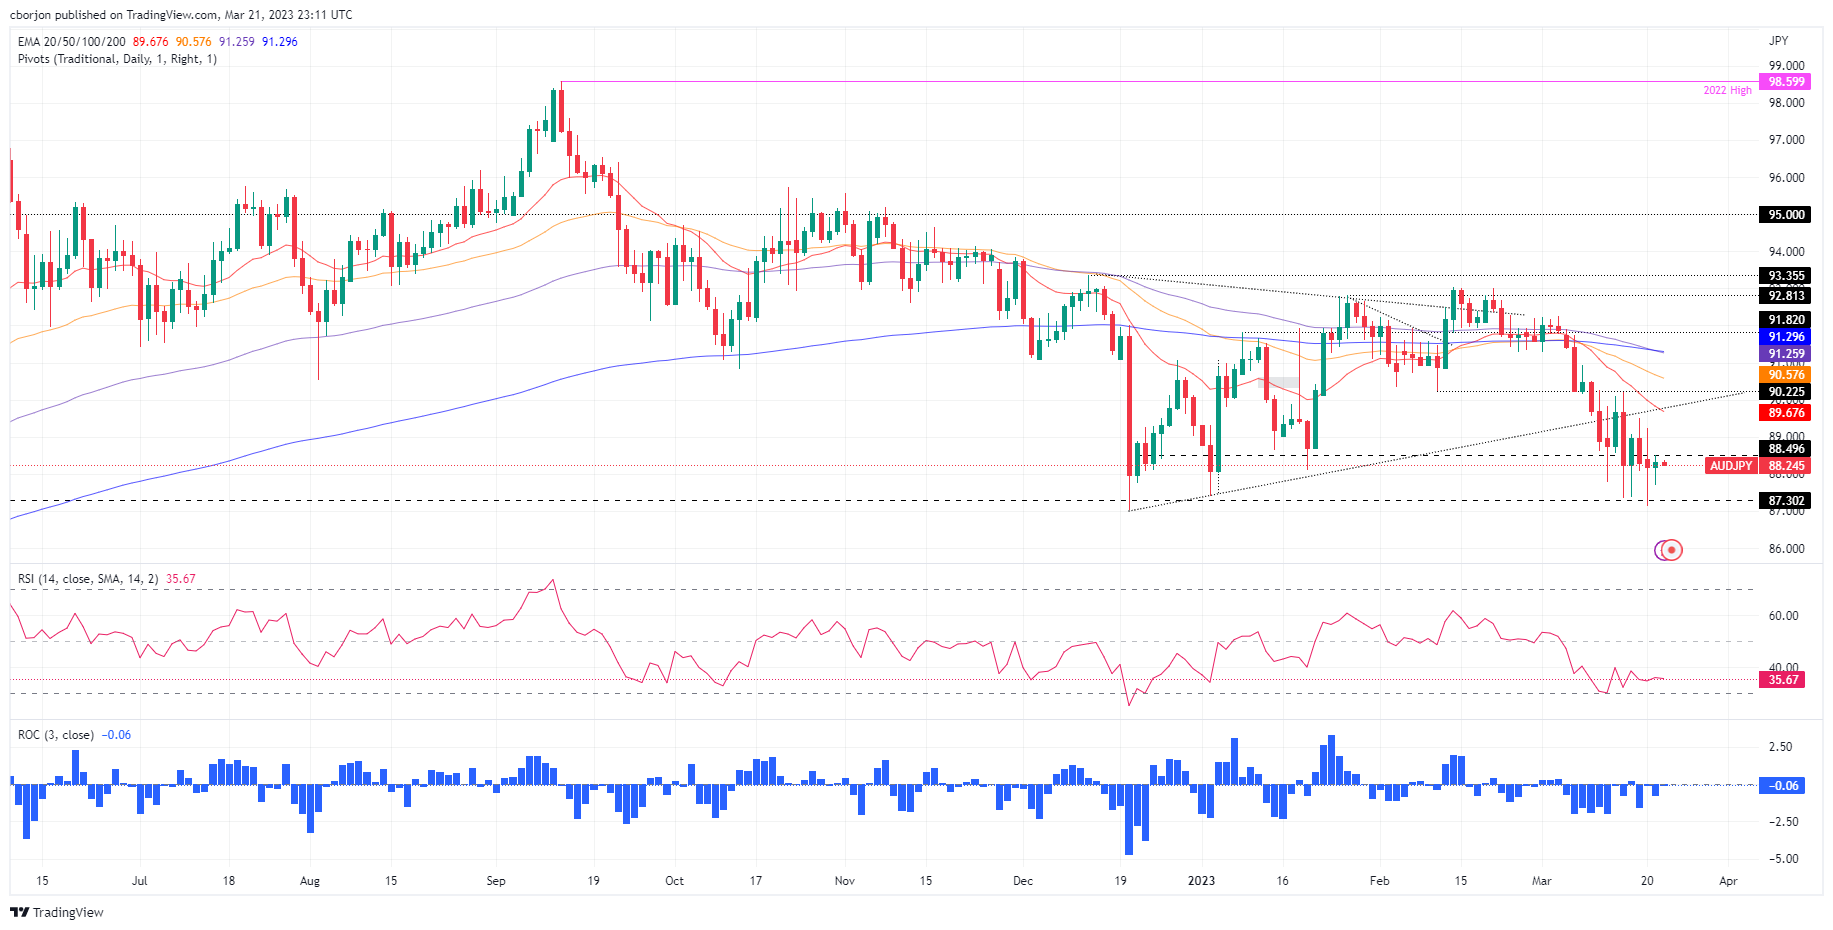
On Monday, the AUD/JPY printed a new YTD low at 87.12, then rallied above the 88.00 mark and registered a huge spinning top candlestick. On Tuesday, price action shrank, as usual, ahead of the US Federal Reserve’s (Fed) monetary policy meeting and formed a hammer. Additionally, price action was well contained within the previous day and formed a bullish harami. That said, the AUD/JPY is headed upward, although oscillators, such as the Relative Strength Index (RSI), stay in bearish territory.

Therefore, the AUD/JPY first resistance would be the March 21 high at 88.50, followed by the 89.00 mark. Once broken, the AUD/JPY would challenge the March 20 high at 89.23. A breach of the latter will expose the 20-day Exponential Moving Average (EMA) at 89.67. ahead of reaching 90.00.

In an alternate scenario, an AUD/JPY bearish continuation could happen if the pair dives below the March 21 lows of 87.71, putting into play a fall toward new YTD lows at 87.12.

AUD/JPY Daily chart

AUD/JPY Daily chart

AUD/JPY Technical levels

AUD/JPY

Overview
Today last price88.31
Today Daily Change0.07
Today Daily Change %0.08
Today daily open88.24
 
Trends
Daily SMA2090.52
Daily SMA5090.98
Daily SMA10091.55
Daily SMA20092.88
 
Levels
Previous Daily High89.24
Previous Daily Low87.14
Previous Weekly High90.2
Previous Weekly Low87.36
Previous Monthly High93.06
Previous Monthly Low90.24
Daily Fibonacci 38.2%87.94
Daily Fibonacci 61.8%88.44
Daily Pivot Point S187.17
Daily Pivot Point S286.1
Daily Pivot Point S385.07
Daily Pivot Point R189.27
Daily Pivot Point R290.31
Daily Pivot Point R391.38

Author

Christian Borjon Valencia

Markets analyst, news editor, and trading instructor with over 14 years of experience across FX, commodities, US equity indices, and global macro markets.

More from Christian Borjon Valencia
Share:

Editor's Picks

EUR/USD holds above 1.1750 after mixed EU PMI data

EUR/USD manages to hold above 1.1750 but struggles to gather recovery momentum on Friday, following the mixed February PMI figures from Germany and the Eurozone. In the second half of the day, Q4 GDP, December inflation and February PMI data from the US will be watched closely by market participants.

GBP/USD recovers further toward 1.3500 after UK PMI data

GBP/USD is recovering ground further toward 1.3500 in European trading on Friday, helped by a modest uptick in the Pound Sterling after stronger-than-expected UK January Retail Sales and February PMI data. However, the pair's further upside could be limited amid persistent US Dollar strength as the focus turns to key US data. 

Gold sticks to positive bias above $5,000 ahead of US data

Gold gains some positive traction for the third consecutive day on Friday. holding above $5,000. Traders now look forward to the key US macro releases – the Advance Q4 GDP report and the Personal Consumption Expenditures (PCE) Price Index – for fresh trading impetus. 

US GDP growth expected to slow down significantly in Q4 after stellar Q3 

The United States Bureau of Economic Analysis will publish the first preliminary estimate of the fourth-quarter Gross Domestic Product at 13:30 GMT. Analysts forecast the US economy to have expanded at a 3% annualized rate, slowing down from the 4.4% growth posted in the previous quarter.

Iran tensions and AI fears at the forefront ahead of key US data

Thursday’s scorecard shows major US Stock benchmarks closed modestly in the red amid mounting US-Iran tensions and AI disruption worries. The S&P 500 shed 19 points (0.3%) to 6,861, the Nasdaq 100 lost 101 points (0.4%) to 24,797, and the Dow Jones Industrial Average dropped 267 points (0.5%) to 49,395.

Official Trump price approaches breakout with mixed signals from traders

Official Trump (TRUMP) is trading at $3.50 at the time of writing, approaching its upper consolidation range. A breakout from this range could open the door for an upside move. On-chain data shows market indecision, with balanced flows between bulls and bears, signaling a lack of clear directional bias.