|

AUD/JPY Price Analysis: Bearish pressure builds as pair slips below 94.00 zone

  • AUD/JPY trades near the 93.80 area ahead of the Asian session, posting losses within the lower end of its daily range.
  • The pair is flashing bearish signals despite a buy reading from the MACD, with momentum indicators and moving averages skewing negative.
  • Support lies near 93.78, while resistance appears around the 94.05–94.27 zone.

The AUD/JPY pair drifted lower on Monday’s session ahead of the Asian open, trading around the 93.80 zone and extending its decline toward the bottom of its intraday range. The pair remains under mild pressure as market sentiment turns cautious. Technical indicators and trend signals are increasingly skewed to the downside, even though some momentum readings offer mixed signals.

Daily chart

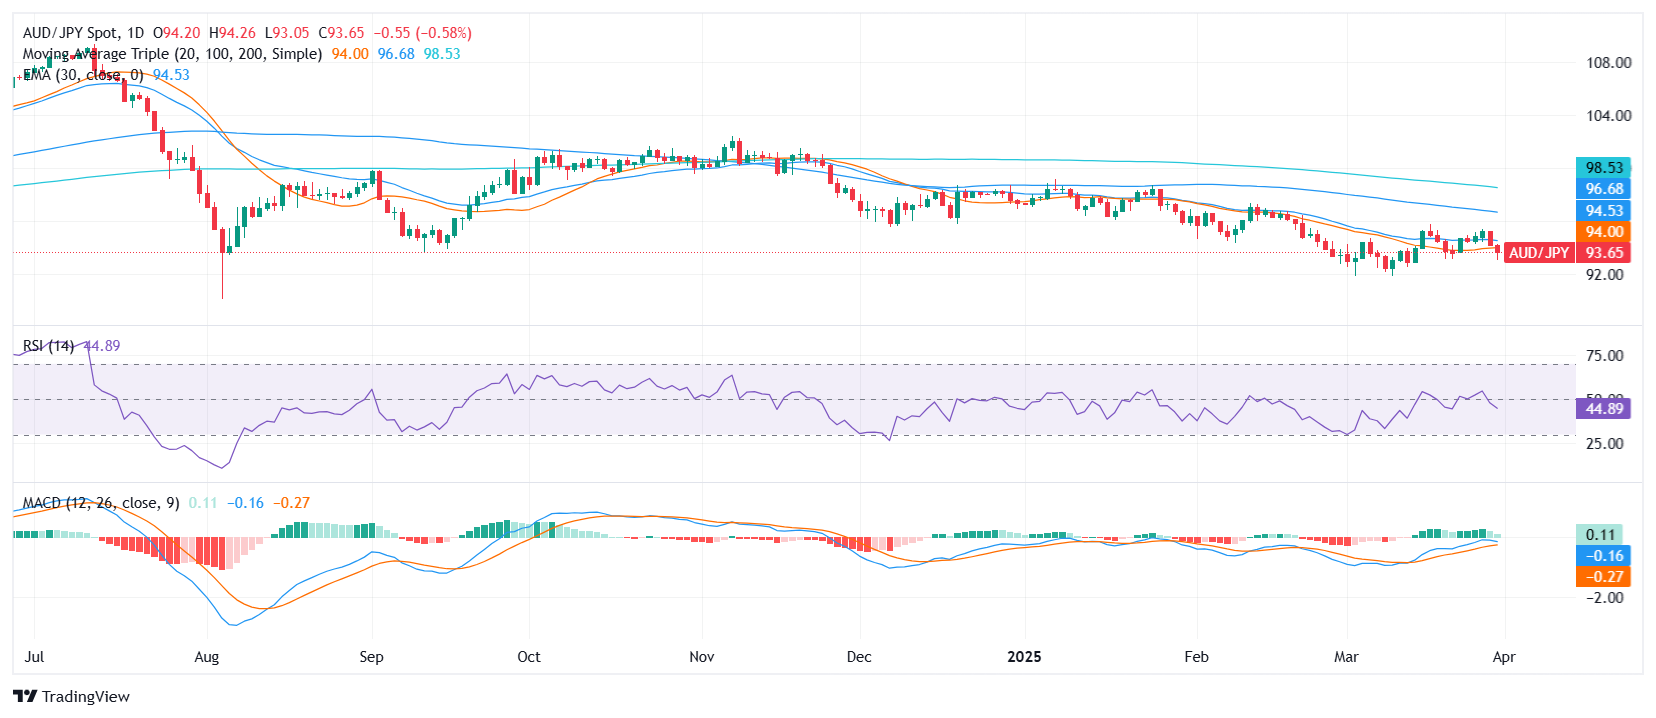
Looking at trend indicators, all key moving averages reinforce selling pressure. The 20-day SMA at 94.05, 100-day SMA at 96.76, and 200-day SMA at 98.63 are all tilted downward, with shorter-term averages like the 10-day EMA (94.33) and SMA (94.43) also pointing south. These align with the broader bearish technical tone for the pair.

Immediate support can be found at 93.78, with further downside targets near 93.05. On the upside, resistance levels are stacked at 93.92, 94.05, and 94.26. Unless the pair reclaims ground above these zones, the path of least resistance remains to the downside.

Author

Patricio Martín

Patricio is an economist from Argentina passionate about global finance and understanding the daily movements of the markets.

More from Patricio Martín
Share:

Markets move fast. We move first.

Orange Juice Newsletter brings you expert driven insights - not headlines. Every day on your inbox.

By subscribing you agree to our Terms and conditions.

Editor's Picks

EUR/USD bears await break below 100-day SMA support near 1.1665 area

The EUR/USD pair attracts heavy selling for the second straight day and dives to a nearly four-week trough, around the 1.1670 region, during the Asian session on Monday. Bearish traders now await a sustained break below the 100-day Simple Moving Average before positioning for an extension of the recent pullback from a three-month top, or levels just above the 1.1800 mark touched on December 24.

GBP/USD falls toward 1.3400 near 50-day EMA

GBP/USD extends its losses for the second successive session, trading around 1.3420 during the Asian hours on Monday. The technical analysis of the daily chart indicates that the 14-day Relative Strength Index at 53 has eased from near overbought, indicating that momentum has cooled while remaining above the midline. RSI holds above 50, keeping a modest bullish bias.

Gold on fire at the start of the week on US-Venezuela tensions

Gold regains upside traction early Monday as flight to safety prevails on Venezuela turmoil. The US Dollar finds strong haven demand, caps Gold’s upside as focus shifts to US jobs data. Gold’s daily technical setup suggests that more upside remains in the offing.

Bulls firmly in control as Bitcoin breaks $93K, Ethereum and Ripple extend gains

Bitcoin, Ethereum, and Ripple extended their rallies on Monday, gaining more than 4%, 6%, and 12%, respectively, in the previous week. The top three cryptocurrencies by market capitalization could continue to outperform, with bulls in control of the momentum.

Economic outlook 2026-2027 in advanced countries: Solidity test

After a year marked by global economic resilience and ending on a note of optimism, 2026 looks promising and could be a year of solid economic performance. In our baseline scenario, we expect most of the supportive factors at work in 2025 to continue to play a role in 2026.

Meme Coins Price Prediction: Dogecoin, Shiba Inu, Pepe rally on Venezuela’s shadow BTC reserve

Meme coins such as Dogecoin, Shiba Inu, and Pepe are leading the cryptocurrency market rally driven by the US cross-border operation to capture Venezuelan President Nicolás Maduro. Dogecoin extends its gain for the fifth consecutive day while SHIB and PEPE take a pause.