|

AUD/JPY Price Analysis: Bearish-flag in the daily chart targets the 200-DMA

  • AUD/JPY extends its losses to four straight days.
  • Pure market sentiment plays had been the main driver of the AUD/JPY.
  • AUD/JPY’s break below 91.00 would exacerbate a dive toward the 200-DMA.

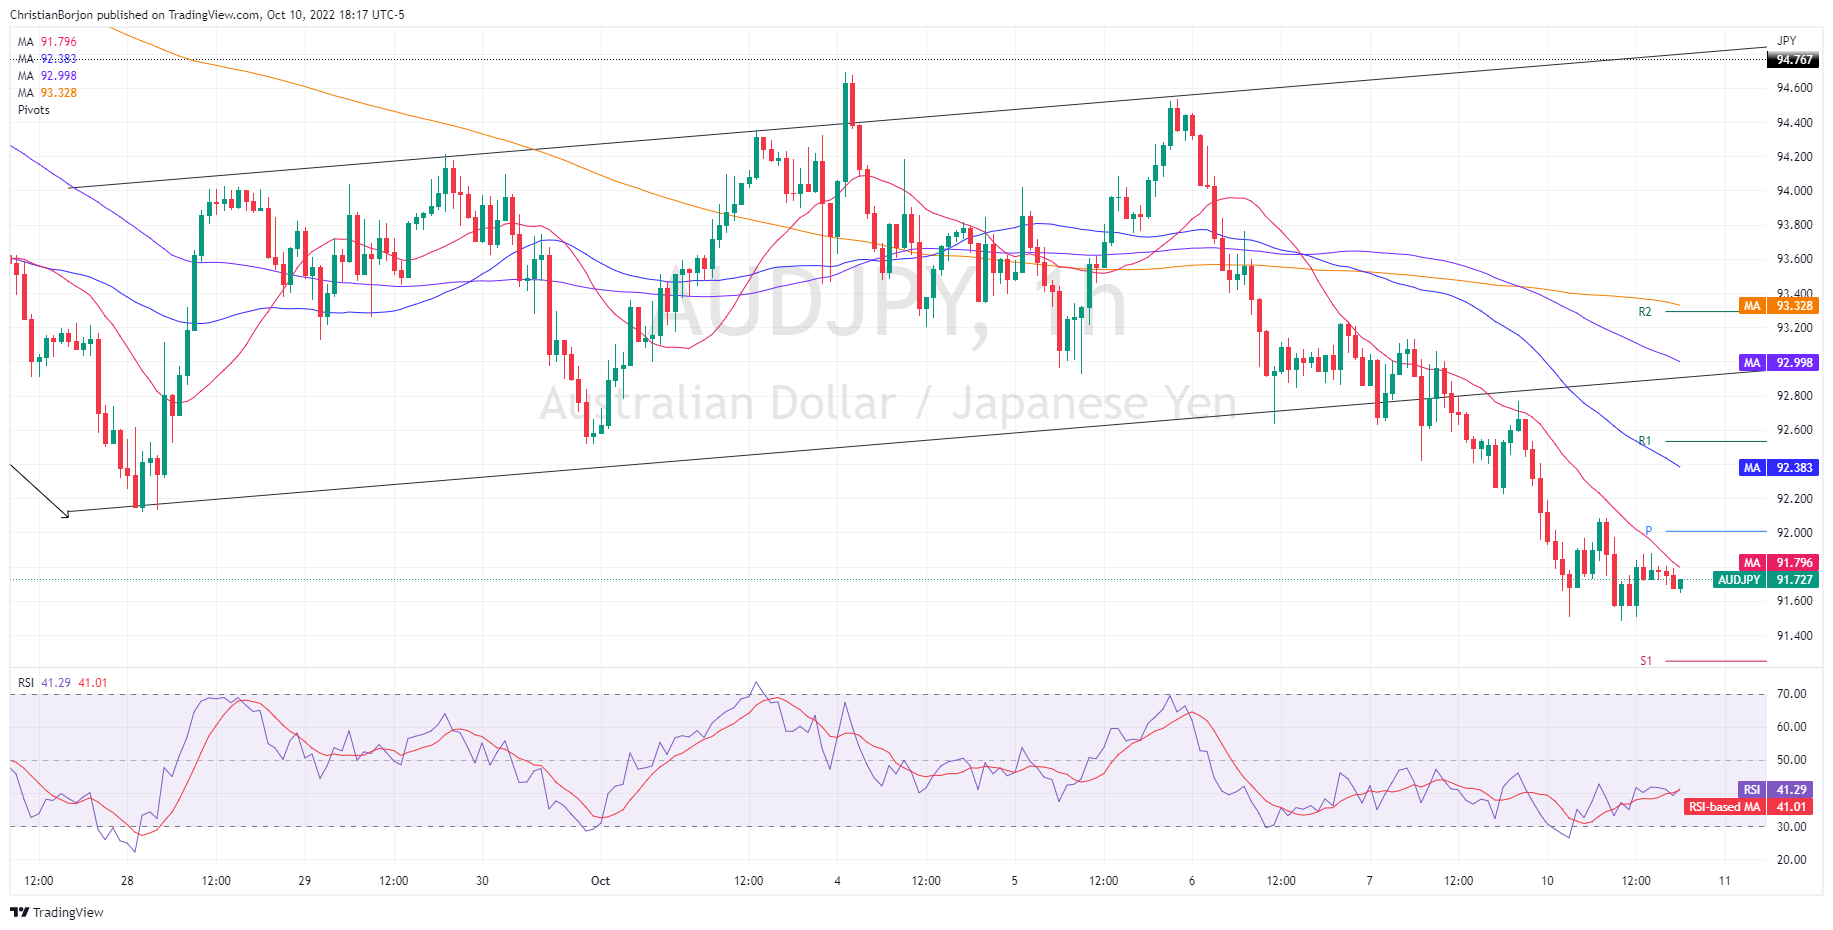
The AUD/JPY falls as the Asian Pacific session begins, breaking below the bottom-trendline of a bearish flag, opening the door for a drop to the 200-day EMA at 90.67, which would be a fresh two-month low. At the time of writing, the AUD/JPY is trading at 91.73, below its opening price, by 0.02%.

AUD/JPY Price Forecast

The AUD/JPY it’s usually a cross-currency pair subject to market sentiment. As reflected by the daily chart, price action illustrates three straight days of losses, meaning that risk aversion had been the main driver, weighing on the cross. As above-mentioned, the AUD/JPY broke downwards, as suggested by the bearish flag, which targets the 200-day EMA. On its way south, the AUD/JPY first support would be the 91.00 figure, followed by the 200-day EMA at 90.67. If AUD/JPY sellers gather momentum, a fall toward 90.00 is on the cards.

The AUD/JPY one-hour time frame is downward biased due to the cross staying below the 20-EMA. It should be noted that the Relative Strength Index (RSI remained steady below the 50-midline in bearish territory and got into oversold territory around yesterday’s trading session. Nevertheless, unless buyers step in and clear key resistance around 91.79 (20-day EMA), that would pave the way toward the daily pivot at 92.00. If that scenario plays out, the AUD/JPY next potential supply zone would be the 50-EMA at 92.38, followed by the R1 daily pivot at 92.54.

On the flip side, the AUD/JPY’s first support would be October’s 10 daily low at 91.48, followed by the S1 daily pivot at 91.24, followed by the 91.00 figure.

AUD/JPY Key Technical Levels

AUD/JPY

Overview
Today last price91.72
Today Daily Change-0.83
Today Daily Change %-0.90
Today daily open92.55
 
Trends
Daily SMA2094.74
Daily SMA5094.7
Daily SMA10094.12
Daily SMA20090.62
 
Levels
Previous Daily High93.23
Previous Daily Low92.41
Previous Weekly High94.7
Previous Weekly Low92.41
Previous Monthly High98.58
Previous Monthly Low92.13
Daily Fibonacci 38.2%92.72
Daily Fibonacci 61.8%92.92
Daily Pivot Point S192.23
Daily Pivot Point S291.91
Daily Pivot Point S391.41
Daily Pivot Point R193.05
Daily Pivot Point R293.56
Daily Pivot Point R393.88

Author

Christian Borjon Valencia

Markets analyst, news editor, and trading instructor with over 14 years of experience across FX, commodities, US equity indices, and global macro markets.

More from Christian Borjon Valencia
Share:

Editor's Picks

EUR/USD climbs to daily highs near 1.1820

EUR/USD now picks up pace and advances to the area of daily peaks north of the 1.1800 barrier at the end of the week. The pair’s decent move higher comes against the backdrop of a generalised lack of direction in the FX galaxy and the mild offered stance in the US Dollar.

GBP/USD trims losses, retests 1.3460

After briefly challenging its key 200-day SMA near 1.3440, GBP/USD now manages to regain some balance and revisit the 1.3460 zone on Friday. Cable’s pullback comes as the selling pressure on the Greenback gathers traction, reigniting some recovery in the risk-linked space.

Gold flirts with four-week highs past $5,200

Gold extends its rebound, climbing for a third consecutive session and pushing back above the $5,200 mark per troy ounce on Friday. The move higher continues to draw support from lingering geopolitical tensions and the ongoing uncertainty surrounding US trade policy, both of which are keeping safe-haven demand firmly in play.

Iran escalation: Quick thoughts on markets

Markets are likely to open the week with risk-off, with declines led by airlines, cyclicals and trade-exposed names, while energy, defense and “strategic” sectors may be relatively steadier.

Oil at a critical breakpoint: Will geopolitics trigger the next major move?

The week ahead blends two powerful forces: moderating economic momentum and increasing geopolitical tension. While US and Eurozone data suggest steady but unspectacular growth, rising friction between the US and Iran is injecting a fresh risk premium into energy markets. Macro is softening but geopolitics may dominate price action.

Starknet unveils strkBTC, shielded Bitcoin transactions on Ethereum Layer 2

Starknet, the Ethereum Layer 2 network developed by StarkWare, today announced strkBTC, a wrapped Bitcoin asset that introduces optional shielding while preserving full DeFi composability.