AUD/JPY Price Analysis: Bearish bias holds despite intraday gains
- AUD/JPY trades near the 91.00 zone after bouncing within Wednesday’s range.
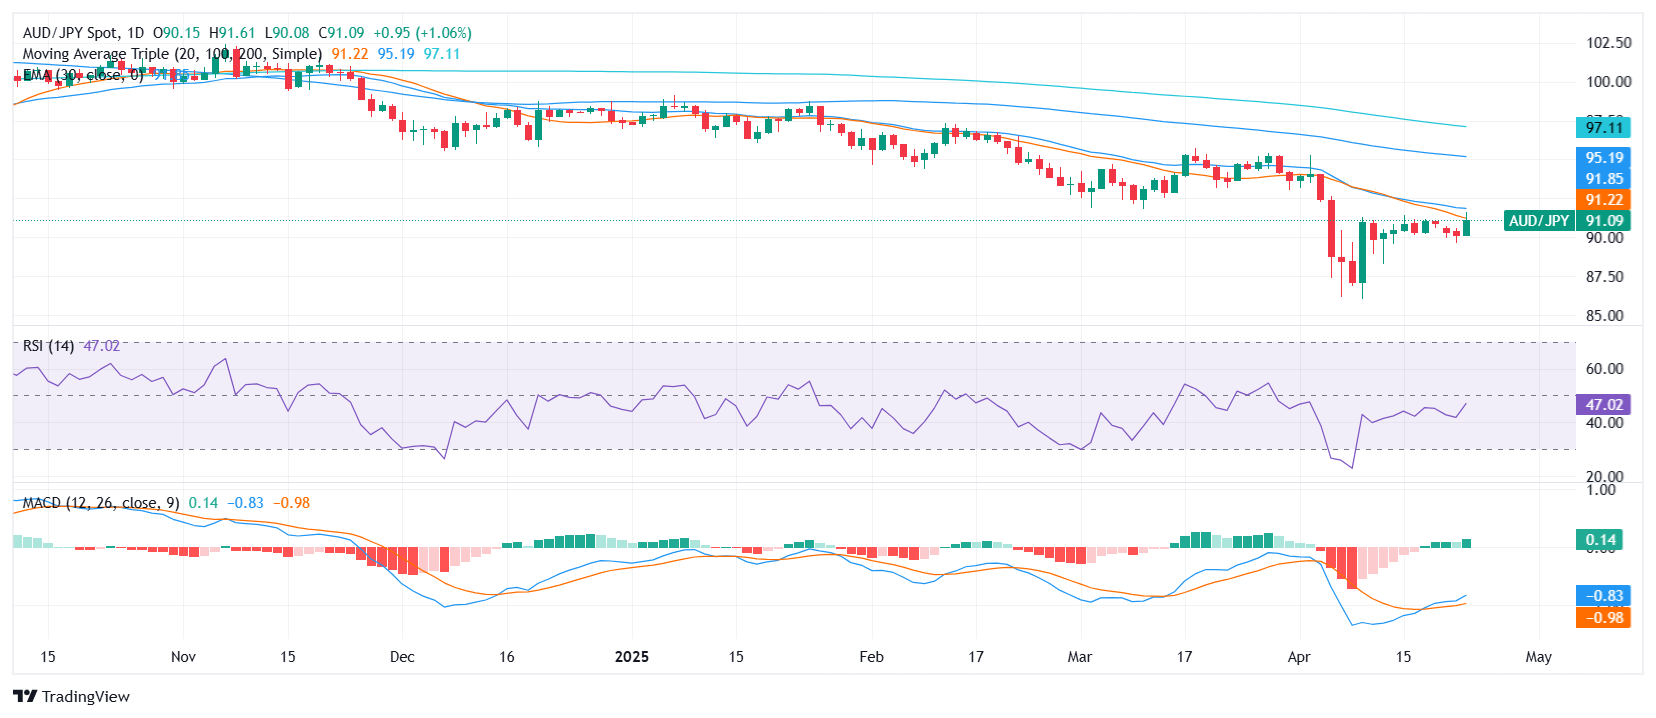
- The broader trend remains bearish amid pressure from longer-term moving averages.
- Key resistance is seen near the 91.20–91.80 zone, with support near 90.70.

The AUD/JPY pair was seen around the 91.00 zone in Wednesday’s session, staging a modest intraday advance ahead of the Asian session. Despite the bounce from earlier lows, the pair retains a bearish overall tone, capped by key moving averages and a sluggish momentum backdrop. Technical indicators are mixed, with the Relative Strength Index hovering around neutral territory, the MACD suggesting upside potential, and moving averages still tilting south. Price action remains confined to the middle of today’s daily range, which points to indecision in the near term.
From a technical perspective, the pair is gaining some ground but lacks the strength to break decisively higher. The RSI is neutral around the 47 mark, while the Stochastic %K and Commodity Channel Index also print neutral readings, reinforcing the lack of clear direction in short-term momentum. The MACD, however, offers a mild bullish signal, hinting at the possibility of further upside attempts.
Despite this, the broader outlook remains tilted to the downside. The 20-day, 100-day, and 200-day Simple Moving Averages all slope downward, exerting resistance from above. Notably, the 30-day EMA and SMA, seen near the 91.80–92.20 region, act as dynamic barriers capping recent gains and validating the bearish bias.
Immediate support lies in the 90.70–90.60 range, which has held earlier dips. Should sellers regain control, a break below this zone could expose deeper losses. On the upside, resistance clusters around 91.20, 91.25, and 91.85 — levels that coincide with key averages and recent swing highs.
Overall, while AUD/JPY managed to claw back some ground during Wednesday’s trade, the prevailing trend remains bearish unless a firm break above the 91.80 zone materializes. Traders should watch for confirmation in the coming sessions as the pair continues to oscillate within a narrowing range.
Daily chart
Author

Patricio Martín
FXStreet
Patricio is an economist from Argentina passionate about global finance and understanding the daily movements of the markets.


