|

AUD/JPY Price Analysis: Aussie drops sharply toward 87.00 as bearish pressure intensifies

  • AUD/JPY trades near the 87.00 zone after falling heavily during Tuesday’s session.
  • Momentum remains bearish as sellers dominate, with price near the lower end of its daily range.
  • Resistance stands around the 87.48 to 91.24 zone, while longer-term moving averages reinforce the downtrend.

The AUD/JPY pair extended its losses on Tuesday, trading near the 87.00 area ahead of the Asian session. The cross has dropped significantly on the day, falling near the bottom of its daily range, reflecting persistent downside pressure. The move has come alongside weakening short-term momentum indicators and a broader bearish structure confirmed by long-term trend signals.

Daily chart

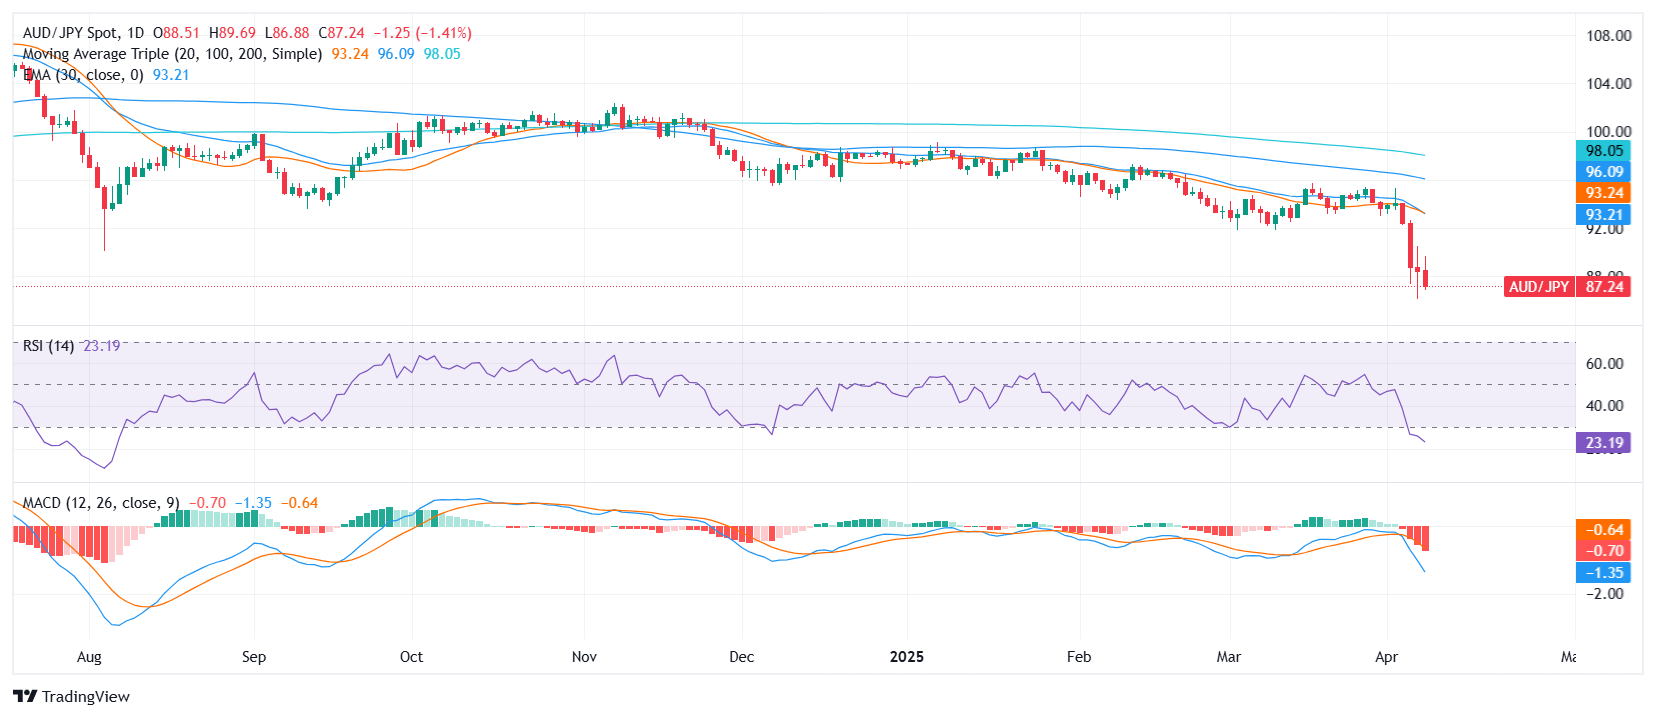
From a technical standpoint, the Relative Strength Index (RSI) sits at 22.24, entering oversold territory but not yet reversing, which suggests bearish momentum remains in place. The Moving Average Convergence Divergence (MACD) prints a sell signal, in line with the broader trend. Meanwhile, both the Bull Bear Power indicator (−6.794) and Stochastic %K (17.85) are showing neutral signals, signaling no immediate shift in direction.

Reinforcing the negative sentiment, all key moving averages continue to flash sell signals. The 10-day Exponential Moving Average (EMA) at 91.24 and 10-day Simple Moving Average (SMA) at 92.28 sit far above current price action. Similarly, the 20-day SMA (93.24), 100-day SMA (96.17), and 200-day SMA (98.16) maintain their downward slope, confirming the dominant bearish outlook.

Author

Patricio Martín

Patricio is an economist from Argentina passionate about global finance and understanding the daily movements of the markets.

More from Patricio Martín
Share:

Markets move fast. We move first.

Orange Juice Newsletter brings you expert driven insights - not headlines. Every day on your inbox.

By subscribing you agree to our Terms and conditions.

Editor's Picks

EUR/USD holds steady near 1.1750 on first trading day of 2026

EUR/USD stays calm on Friday and trades in a narrow channel at around 1.1750 as trading conditions remain thin following the New Year holiday and ahead of the weekend. The economic calendar will not feature any high-impact data releases.

GBP/USD struggles to gain traction, stabilizes above 1.3450

After testing 1.3400 on the last day of 2025, GBP/USD managed to stage a rebound. Nevertheless, the pair finds it difficult to gather momentum and moves sideways above 1.3450 as market participants remain in holiday mood.

Gold climbs toward $4,400 following deep correction

Gold reverses its direction and advances toward $4,400 after suffering heavy losses amid profit-taking before the New Year holiday. Growing expectations for a dovish Fed policy and persistent geopolitical risks seem to be helping XAU/USD stretch higher.

Cardano gains early New Year momentum, bulls target falling wedge breakout

Cardano kicks off the New Year on a positive note and is extending gains, trading above $0.36 at the time of writing on Friday. Improving on-chain and derivatives data point to growing bullish interest, while the technical outlook keeps an upside breakout in focus.

Economic outlook 2026-2027 in advanced countries: Solidity test

After a year marked by global economic resilience and ending on a note of optimism, 2026 looks promising and could be a year of solid economic performance. In our baseline scenario, we expect most of the supportive factors at work in 2025 to continue to play a role in 2026.

Crypto market outlook for 2026

Year 2025 was volatile, as crypto often is.  Among positive catalysts were favourable regulatory changes in the U.S., rise of Digital Asset Treasuries (DAT), adoption of AI and tokenization of Real-World-Assets (RWA).