AT&T (T) stock’s bullish run: What investors should expect

AT&T Inc. (T) is an American multinational telecommunications holding company headquartered in Dallas, Texas. It is the world’s largest telecommunications company by revenue and the third-largest provider of mobile telephone services in the U.S.
AT&T (T) monthly chart September 2024
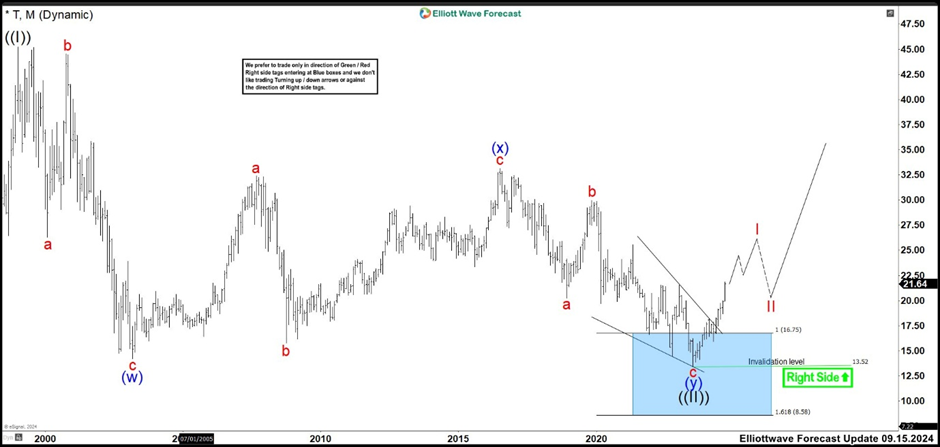
In the last monthly chart, we saw the rally that left from the blue box. The rally does not mean that T cannot resume to the downside again. To confirm that wave ((II)) is over at $13.43 low, the market needs to break above of wave ((I)) high. Until then, T could make perfectly any other structure that leads us to lower prices. At the moment, the stock is doing very well suggesting the trend is developing an impulse structure. (If you want to learn more about Elliott Wave Theory, follow these links: Elliott Wave Education and Elliott Wave Theory).
AT&T (T) weekly chart September 2024
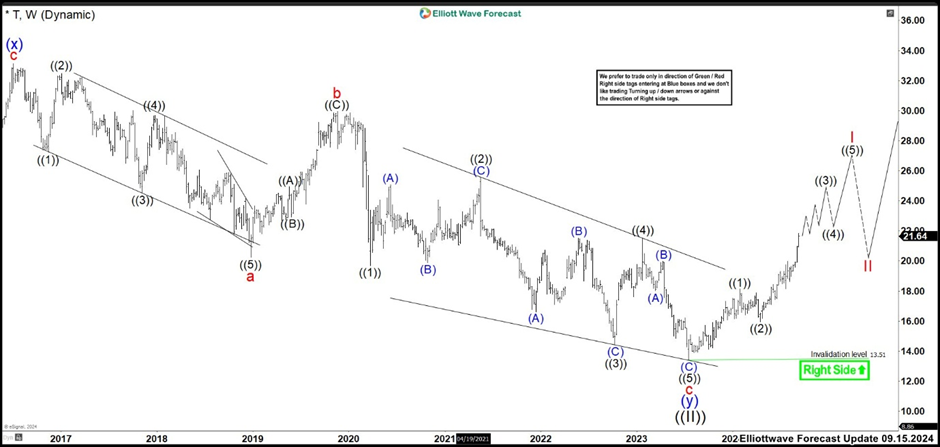
Also in September, the weekly chart above showed how the wave ((5)) of c of the ending diagonal completed the structure. Wave ((II)) ended at $13.43 low and rallied looking to build an impulse higher as wave I. The first leg higher as wave ((1)) ended at $18.16 high. Wave ((2)) pullback finished at $15.94 low and resumed higher again. AT&T pushed strongly to the upside breaking the pivots of the RSI in the weekly timeframe, suggesting that the cycle from 2019 high was over. Then, we expected to build an impulse structure as the chart before seeing 3, 7 or 11 swings correction as wave II.
AT&T (T) weekly chart February 2025
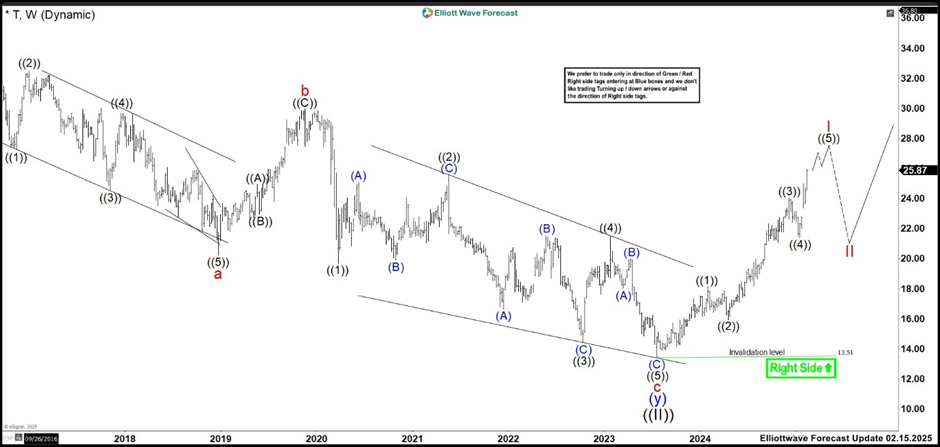
After 5 months, the stock is showing a clear structure of 5 swings given the idea of the impulse structure is very possible. Wave ((3)) completed at 24.03 high and the correction as wave ((4)) ended at 21.38 low. T continued to the upside and the last EPS results better than the expectations, triggered a strong uptrend movement. Currently, we are expecting an extension structure as wave ((5)) and the market is doing wave (3) of ((5)). Once wave (3) is completed, we must see a clear pullback to called wave (4) of ((5)). Then, we expect to do a last push higher to end wave (5) of ((5)) and also wave I before seeing wave II correction. We are projecting that wave I must end in 26.44 – 28.64 area. Let see what the market give us. Trade smart!
Author

Elliott Wave Forecast Team
ElliottWave-Forecast.com


