ASX Limited Elliott Wave technical analysis [Video]
![ASX Limited Elliott Wave technical analysis [Video]](https://editorial.fxsstatic.com/images/i/General-Stocks_2_XtraLarge.png)
ASX Elliott Wave technical analysis
Today's Elliott Wave analysis presents an update on the Australian Stock Exchange (ASX) and ASX LIMITED – ASX.
We observe strong upside potential within the third wave of the third wave, suggesting a significant growth opportunity for ASX LIMITED. This analysis outlines potential trend perspectives and key confirmation points to track trend changes effectively.
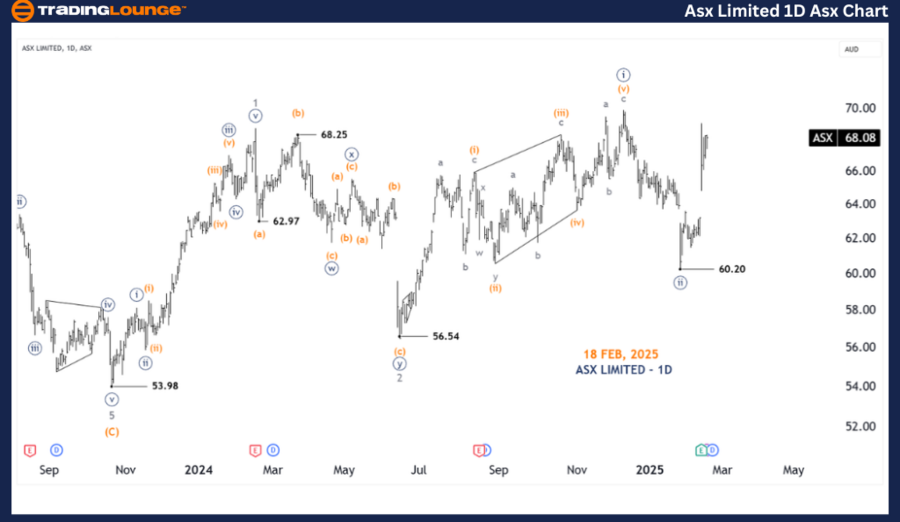
One-day chart (semilog scale) analysis
-
Function: Major Trend (Minor Degree, Grey).
-
Mode: Motive.
-
Structure: Impulse.
-
Position: Wave ((iii)) - Navy of Wave 3 - Grey.
Details:
Current observations indicate that Wave 3 - Grey may be unfolding as an extended wave, with ((iii)) - Navy progressing higher. This scenario suggests significant upside potential within the third wave of the third wave.
- Invalidation Point: 60.20
ASX Elliott Wave technical analysis
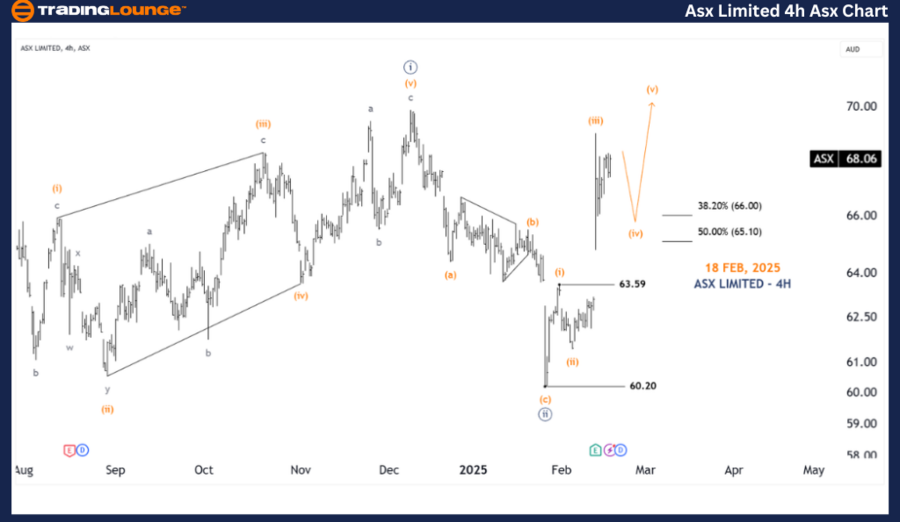
Four-hour chart analysis
-
Function: Major Trend (Minor Degree, Grey).
-
Mode: Motive.
-
Structure: Impulse.
-
Position: Wave (iv) - Orange of Wave ((iii)) - Navy.
Details:
Upon closer examination, since 60.20, Wave ((iii)) - Navy has begun moving higher. It consists of subwaves (i) - Orange to (iv) - Orange, with Wave (iv) - Orange currently taking more time to complete.
There is a possibility that Wave (iv) - Orange may develop into a sideways formation like a Triangle or Flat before moving higher with Wave (v) - Orange.
- Invalidation point: 63.59.
Conclusion
This analysis provides a contextual market forecast and a short-term outlook for ASX: ASX LIMITED – ASX, offering insights into current trends and potential trading opportunities.
We have identified specific price points that serve as validation or invalidation signals, increasing the confidence in our Elliott Wave count. By incorporating these elements, we aim to deliver an objective and professional market perspective.
ASX Limited Elliott Wave technical analysis [Video]
Author

Peter Mathers
TradingLounge
Peter Mathers started actively trading in 1982. He began his career at Hoei and Shoin, a Japanese futures trading company.


