Are stocks still forming a top?

The S&P 500 continues to consolidate - what’s next?
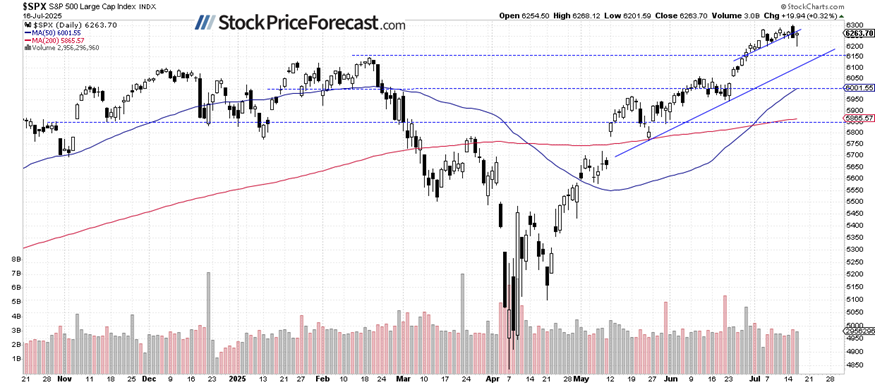
Stocks pulled back on Wednesday as some profit-taking occurred, but the S&P 500 index still closed 0.32% higher, further extending its short-term consolidation. It rebounded from around the 6,200 level, confirming its importance as a support. Today, the market is expected to open flat.
This morning, Retail Sales data came in stronger than expected, rising 0.6% month-over-month (vs. +0.1% expected).
Investor sentiment has slightly deteriorated, as reflected in yesterday’s AAII Investor Sentiment Survey, which reported that 39.3% of individual investors are bullish, while 39.0% are bearish.
The S&P 500 continues to hover near record highs, as the daily chart shows.
Nasdaq 100: New record followed by a pullback
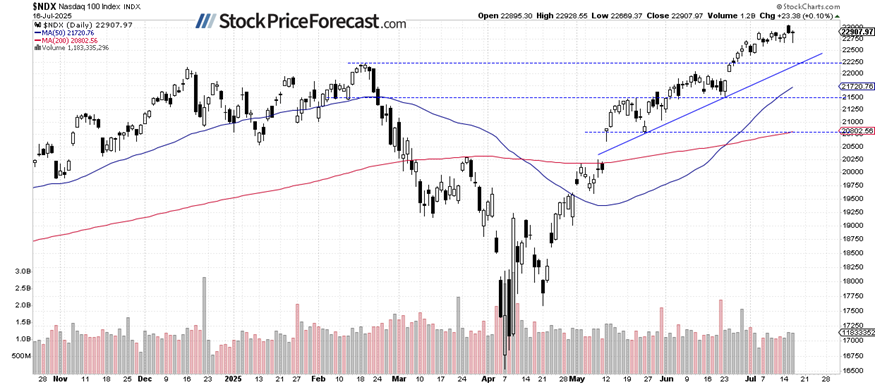
The Nasdaq 100 pulled back from Tuesday’s all-time high of 23,051.87 but managed to close 0.1% higher after rebounding from a local low near 22,670.
While no strong bearish signals have emerged yet, the recent price action may be forming a potential topping pattern.
VIX rebounded before sliding again
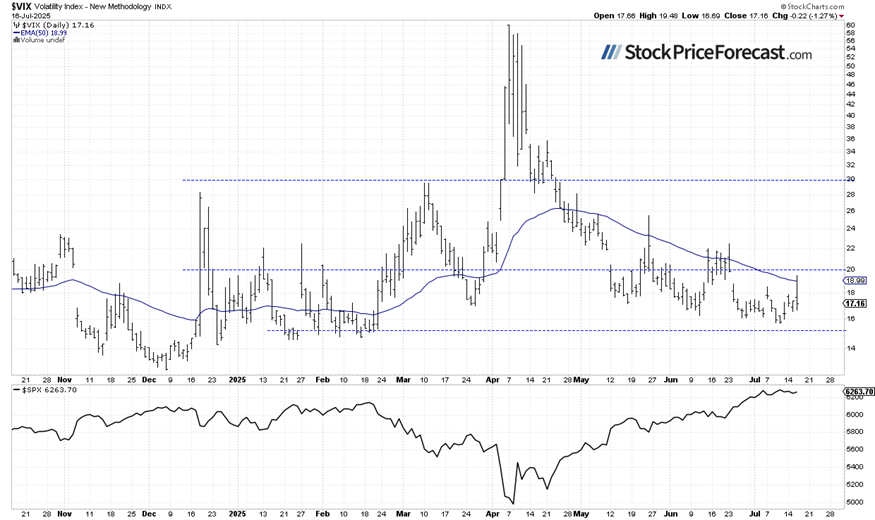
The Volatility Index (VIX) dropped to a local low of 15.70 last Thursday, signaling continued strength in equities. On Wednesday, it rebounded to 19.48 during the intraday market dip but closed near 17, continuing the current consolidation.
Historically, a dropping VIX indicates less fear in the market, and rising VIX accompanies stock market downturns. However, the lower the VIX, the higher the probability of the market’s downward reversal. Conversely, the higher the VIX, the higher the probability of the market’s upward reversal.
S&P 500 futures contract hovers near 6,300
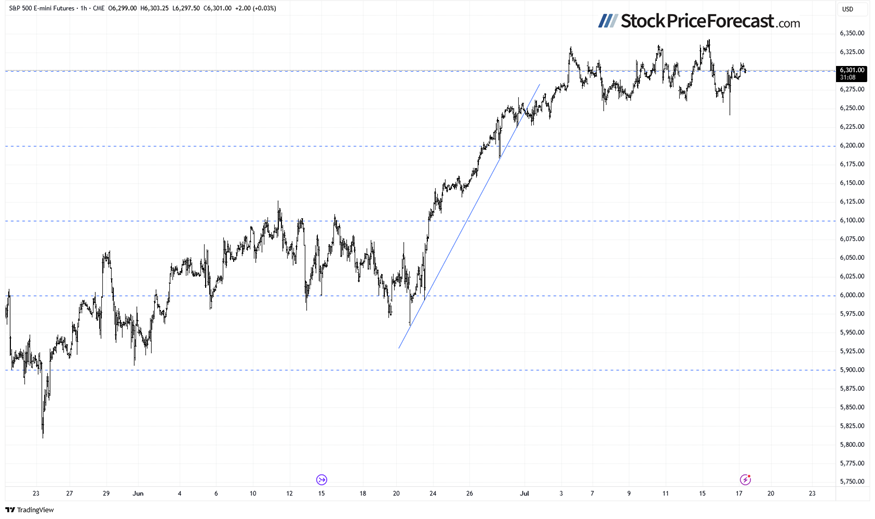
This morning, the S&P 500 futures contract is trading around the 6,300 level again, extending its short-term consolidation after rebounding from Wednesday’s intraday low of around 6,241.
Resistance is near 6,300-6,320, while support is around 6,240-6,260.
Markets remain highly sensitive to geopolitical developments and could stay volatile in the near term.
Crude Oil update: Rebound from $65-66
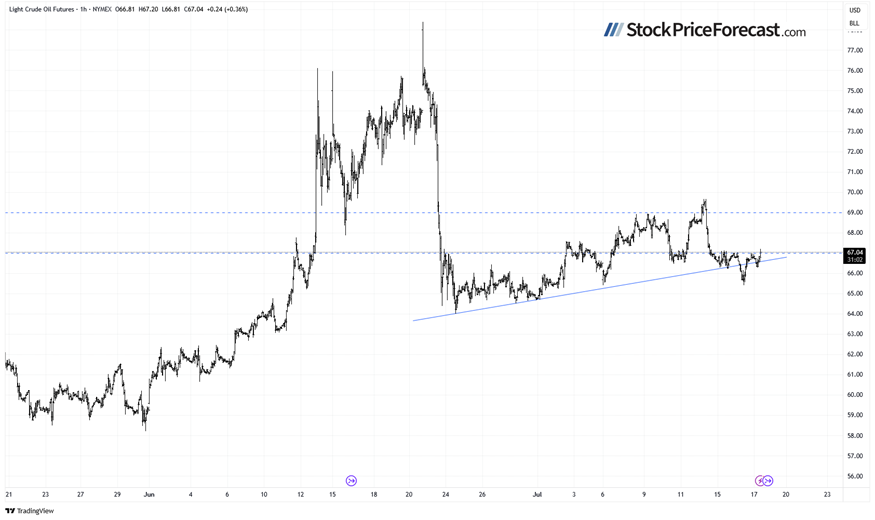
Crude oil declined 0.21% on Wednesday, extending recent losses. However, a larger-than-expected draw in U.S. crude inventories supported a rebound, and oil prices are up about 1.0% today. The recent sell-off appears to be exhausting near the key support zone of $65–66.
For oil markets specifically, these developments are worth monitoring:
-
Oil prices rebounded after a three-day decline, supported by a larger-than-expected 3.9 million barrel drop in U.S. crude inventories, indicating tightening supply.
-
The International Energy Agency noted that production increases aren't boosting inventories, signaling strong demand, while analysts expect short-term volatility due to uncertain U.S. tariffs.
-
Investors remained cautious amid U.S. trade tensions, as President Trump signaled new tariffs on over 150 countries, raising concerns over global oil demand.
Oil hovers along upward trend line
Crude oil has rebounded from support at $65–66, moving back above its nearly month-long upward trend line. Resistance remains near $67.
My short-term outlook on oil remains neutral, and no positions are currently justified from a risk/reward standpoint.
Conclusion
Stock prices remain in consolidation, continuing what appears to be a relatively flat correction within the broader uptrend. However, there's also a lack of strong bullish catalysts to push the market significantly higher in the near term.
Investors are now turning their attention to corporate earnings. Netflix will report after today’s close, while the major tech companies are set to report starting next week.
Here’s the breakdown:
-
The S&P 500 continues to consolidate ahead of key earnings reports.
-
The recent rally extended gains for those who bought based on my Volatility Breakout System.
-
There are no clear bearish signals yet, but a deeper downward correction is not out of the question at some point.
Want free follow-ups to the above article and details not available to 99%+ investors? Sign up to our free newsletter today!
Want free follow-ups to the above article and details not available to 99%+ investors? Sign up to our free newsletter today!
Author

Paul Rejczak
Gold Price Forecast
Paul Rejczak is a stock market strategist who has been known for the quality of his technical and fundamental analysis since the late nineties.